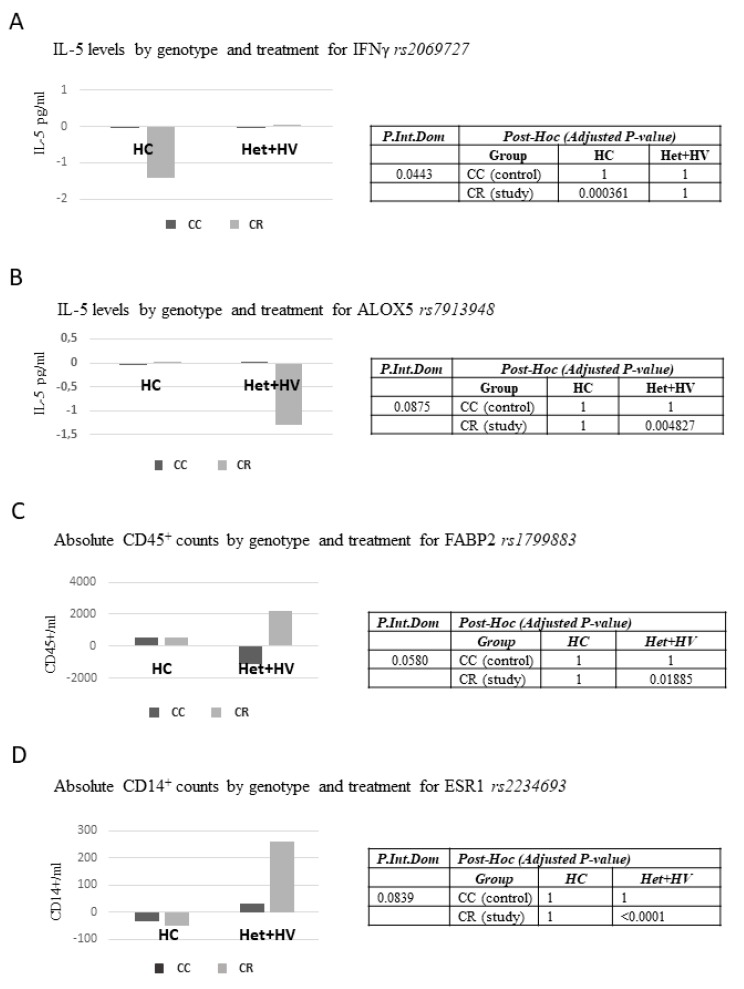
Figure 5.
Associations between genetic variants (SNPs) and responses to the nutritional intervention. (A) IL-5 levels by genotype and treatment for INFγ rs2069727; (B) IL-5 levels by genotype and treatment for ALOX5 rs7913948, (C) Absolute CD45+ counts by genotype and treatment for FABP2 rs1799883, (D) Absolute CD14+ counts by genotype and treatment for ESR1 rs2234693.

