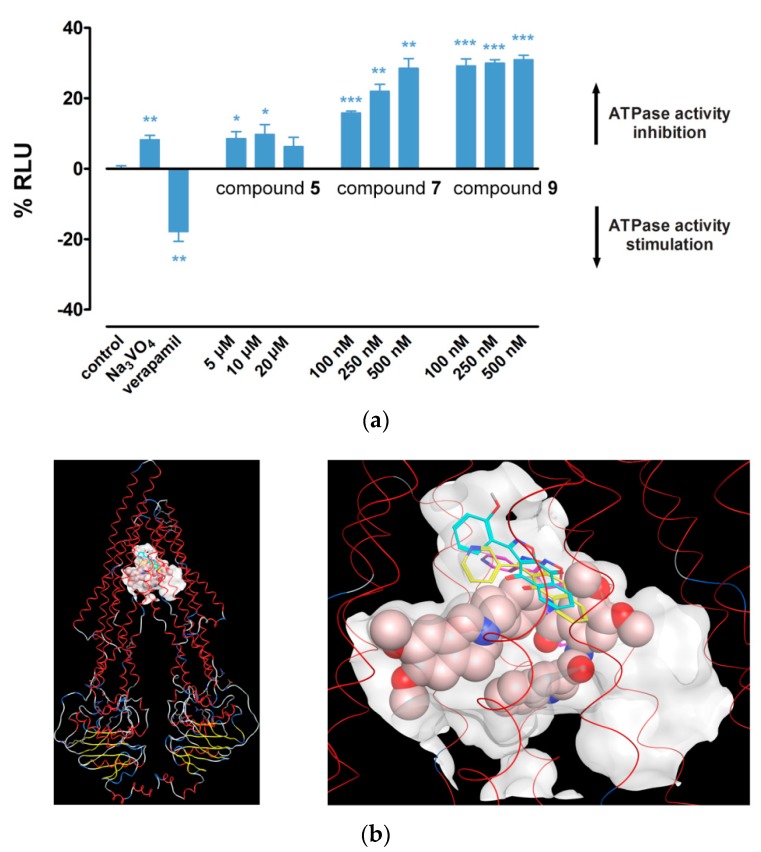
Figure 5.
Hsp90 inhibitors affect the ATPase activity of P-gp by direct binding in the P-gp cavity. (a) Changes in P-gp ATPase activity after treatment with Hsp90 inhibitors. The y-axis represents percentage of change in relative luminescence units (RLU). Control is normalized to zero. Na3VO4 and verapamil are included as positive controls. The results are expressed as mean ± SEM. Statistical significance: p < 0.05 (*), p < 0.01 (**), p < 0.001 (***). (b) Binding poses of compound 5 (C atoms in cyan), compound 7 (C atoms in magenta), compound 9 (C atoms in yellow), and the positive control tariquidar (space filled atoms representation) in the P-gp cavity. The protein backbone is rendered as a line ribbon, and the helices are colored red. The binding site is outlined by the molecular surfaces of the X-ray structures of taxol and two zosuquidar molecules. Both general (left) and close-up views (right) of the binding site are presented.

