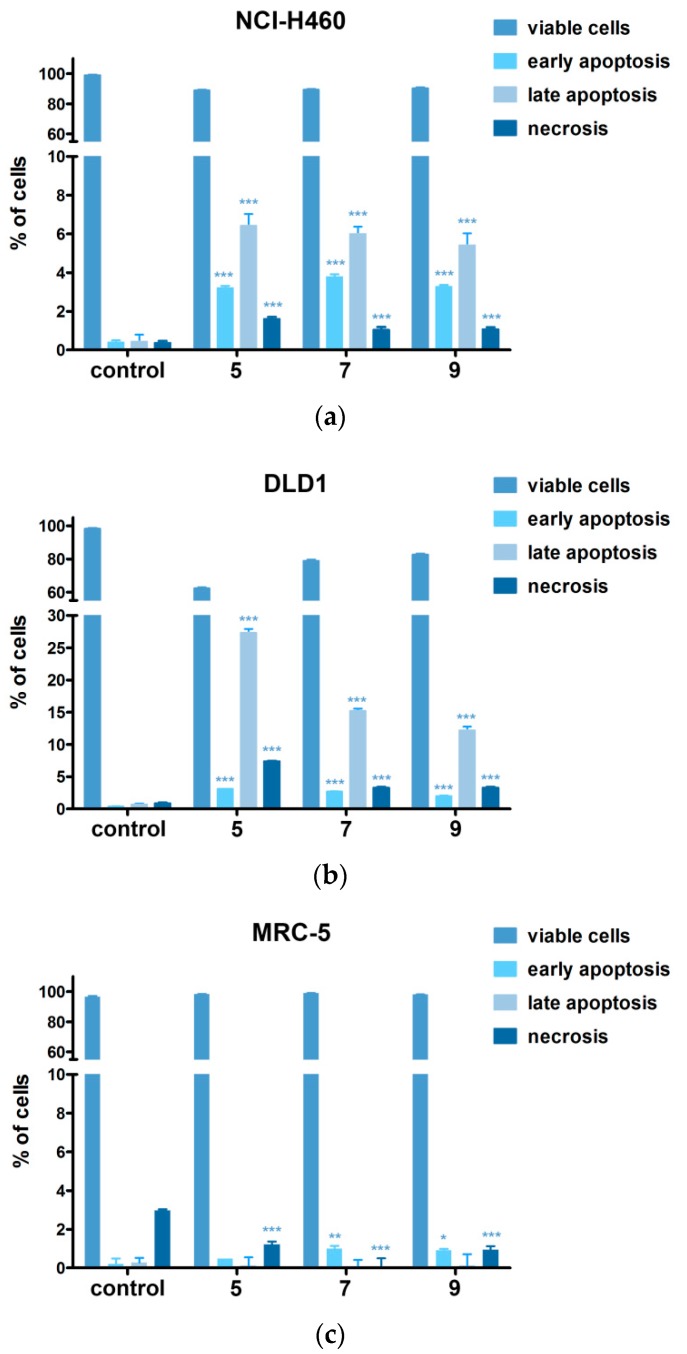
Figure 6.
Cell death analysis confirmed good selectivity profile of Hsp90 inhibitors. Cell death induction in (a) NCI-H460, (b) DLD1 and (c) MRC-5 cells assessed by AV/PI staining after 72 h treatment with compounds 5, 7 and 9. Flow cytometric assay distinguishes viable (AV−PI−), early apoptotic (AV+PI−), late apoptotic (AV+PI+) and necrotic (AV−PI+) cells. The results are expressed as mean ± SEM. Statistical significance to untreated control from three experiments: p < 0.05 (*), p < 0.01 (**), p < 0.001 (***).

