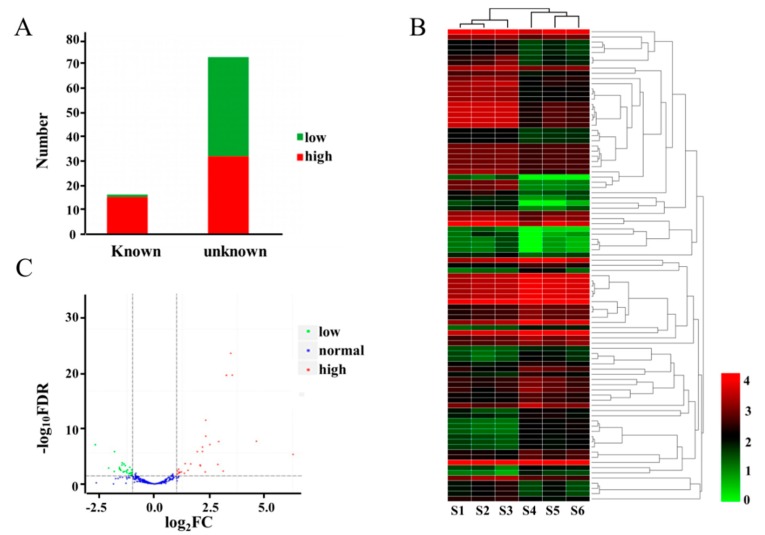
Figure 3.
Expression profiles of the differentially expressed miRNAs (DEMs) between dmc and WT. (A) Stacking bar diagram of the DEMs; (B) Heatmap of the DEMs. S1, S2, S3: mutant dmc; S4, S5, S6: WT. The color scale indicates the values of LgFPKM; FPKM: fragments per kilobase of transcript per million. (C) Volcano plots of the DEMs. The red dots represent the highly expressed DEMs in dmc, green dots represent the lowly expressed DEMs in dmc, and blue dots represent no difference in DEM expression between dmc and WT; FC: fold change; FDR; false discovery rate.

