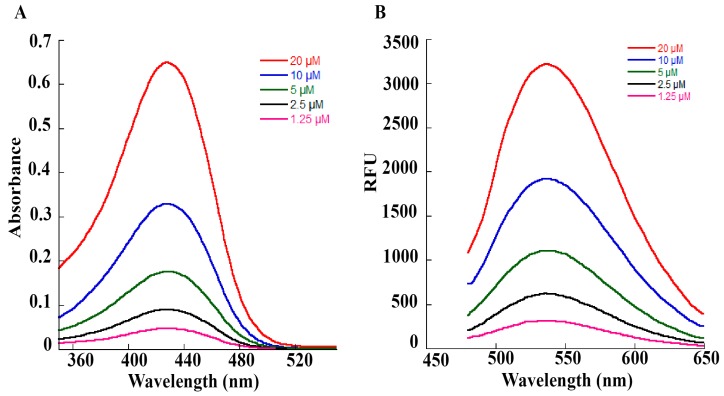
Figure 3.
Spectral analysis of curcuminoid preparation used in our studies. (A) UV–Vis spectra of curcuminoid preparations. Curcuminoids were dissolved in ethanol and spectra were recorded on a SpectraMax M2e spectrophotometer between 350–550 nm. Different concentrations of the curcuminoid extract (1.25–20 µM) were used for recording the spectra. An absorption maximum of 427 nm was observed for our curcuminoid preparation. Based on absorption values obtained from our preparation, an estimation of curcuminoid concentration was performed using a millimolar extinction coefficient of 61.864 cm−1 mM−1 for pure curcumin (Table 1). (B) Fluorescence spectra of increasing concentrations (1.25–20 µM) of curcuminoid preparation were used in our studies. First, an initial scan of excitation wavelength was performed, then in the emission scans, the excitation wavelength was fixed at 425 nm. A smooth emission maximum between 532–538 nm was observed for our curcuminoid preparation.

