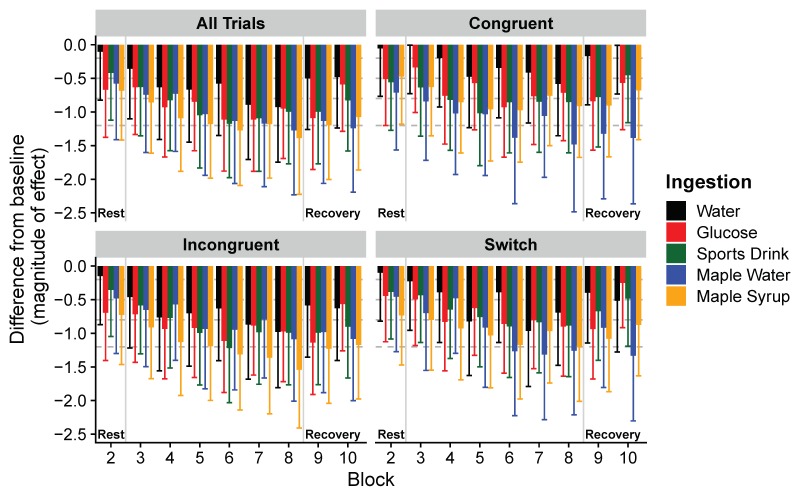
Figure 5.
Magnitude of differences (Hedge’s g effect size (ES), with 95% confidence intervals) in reaction times for all trials, for congruent, incongruent and switching trials and for each block compared to baseline. A decrease in ES represents a faster reaction time compared to baseline cognitive performance. Horizontal dashed lines correspond to very small (<0.2), small (0.2 < ES < 0.5), moderate (0.5 < ES < 0.8), large (0.8 < ES < 1.2), and very large (ES > 1.2) effects [41].

