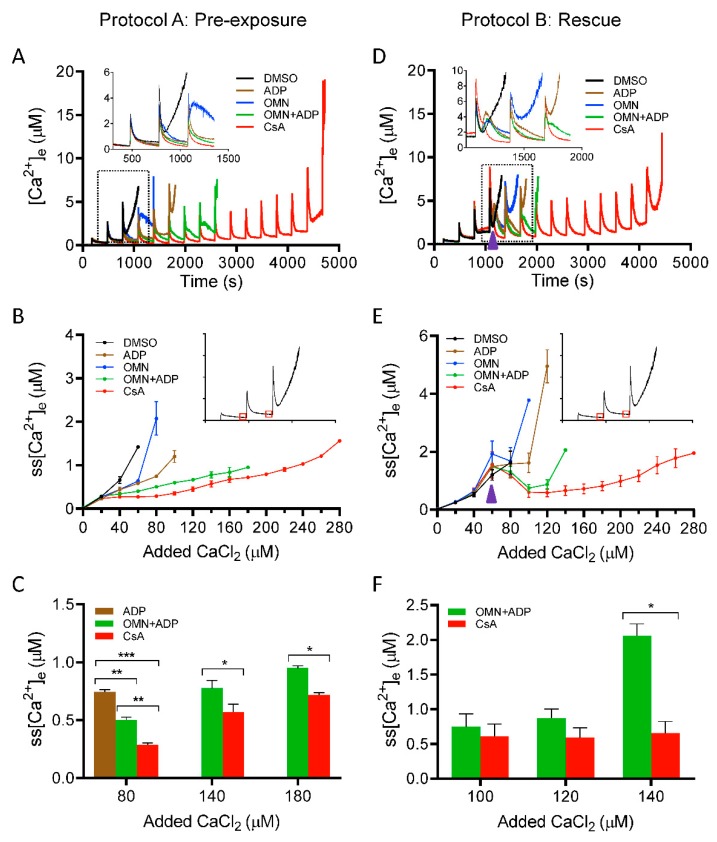
Figure 2.
Effect of CsA and AdN on extra-mitochondrial calcium ([Ca2+]e) dynamics. Mitochondrial Ca2+ uptake and buffering for each of the treatment groups: DMSO (control; black trace), CsA (red trace), ADP (brown trace), OMN (blue trace), or OMN+ADP (green trace) are shown using the protocols depicted in Figure 1. Mitochondrial suspension was exposed to 0.5 μM CsA, 250 μM ADP, 10 μM OMN, or OMN+ADP before adding boluses of 20 μM CaCl2 (Protocol A; left column). Mitochondrial suspension was exposed to added boluses of CaCl2 (20 μM) and rescued mitochondria from mPTP opening (Protocol B; right column) with similar treatments as in Protocol A, at a time point at which it would initiate pore opening. Representative traces show change in extra-matrix free Ca2+ ([Ca2+]e) over time (A), and rescue of mitochondria from mPTP opening (D). Insets (A,D) show Ca2+ uptake kinetics in detail. Steady-state [Ca2+]e (ss[Ca2+]e), 270 s after initiation of Ca2+ uptake, plotted as function of added Ca2+ (20 µM) every 300 s, in delay of mPTP opening (B), and rescue of mitochondria from mPTP opening (E). Insets (B,E) indicate the time points at which ss[Ca2+]e was calculated. Quantification of steady-state [Ca2+]e after a cumulative of 80, 140, and 180 µM CaCl2 during delay of pore opening (C) and cumulative of 100, 120, and 140 µM CaCl2 during rescue of mitochondria from mPTP opening (F). Error bars represent mean ± SEM (* p < 0.05; ** p < 0.01; *** p < 0.005). Arrowhead indicates time of addition of DMSO, ADP, OMN, OMN+ADP, or CsA during Protocol B.

