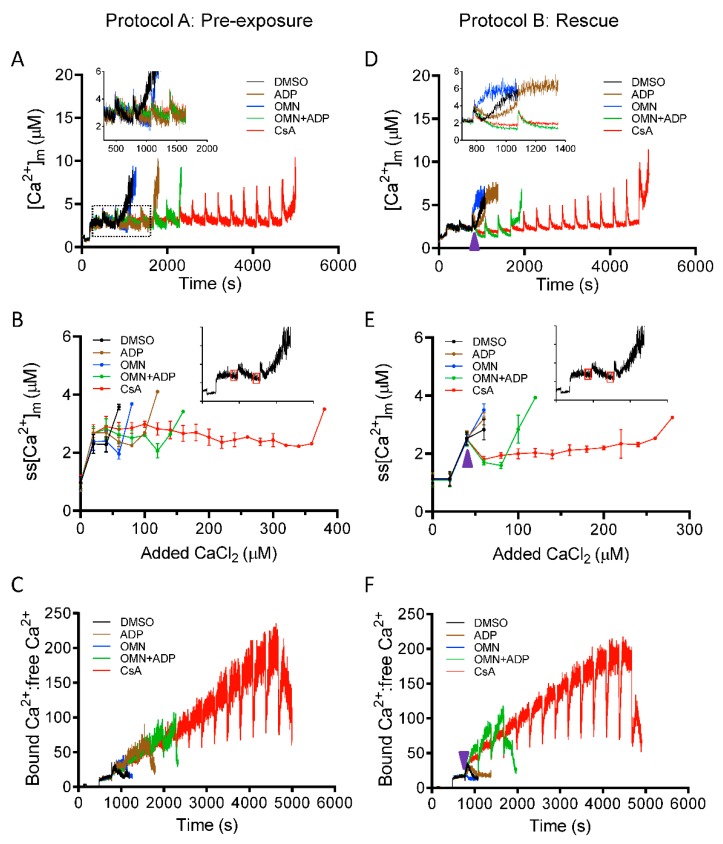
Figure 3.
Effect of CsA and AdN on intra-matrix free Ca2+ ([Ca2+]m) dynamics. Mitochondrial Ca2+ uptake and buffering for each treatment groups, DMSO (control; black trace), CsA (red trace), ADP (brown trace), oligomycin (OMN, blue trace), or combination of OMN+ADP (green trace) are shown using the protocols depicted in Figure 1. Mitochondrial suspension was exposed to 0.5 μM CsA, 250 μM ADP, 10 μM OMN, or OMN+ADP before adding boluses of 20 μM CaCl2 (Protocol A; left column). Mitochondrial suspension was exposed to added boluses of CaCl2 (20 μM) and rescued from mPTP opening (Protocol B; right column) with similar interventions as in Protocol A, at a time point at which it would initiate mPTP opening. Representative traces show changes in [Ca2+]m over time in delay of mPTP opening (A) and rescue of mitochondria from mPTP opening (D). Insets (A,D) show Ca2+ uptake kinetics in detail. Steady-state [Ca2+]m (ss[Ca2+]m), 270 s after initiation of Ca2+ uptake, plotted as function of added Ca2+ (20 µM) every 300 s in delay of mPTP opening (B) and rescue of mitochondria from mPTP from opening (E). Insets (B,E) indicate the time points at which ss[Ca2+]m was calculated. Change in matrix-bound Ca2+:free Ca2+ over time in delay of mPTP opening (C) and rescue of mitochondria from mPTP opening (F). Arrowhead indicates time of addition of DMSO, ADP, OMN, OMN+ADP, or CsA during Protocol B.

