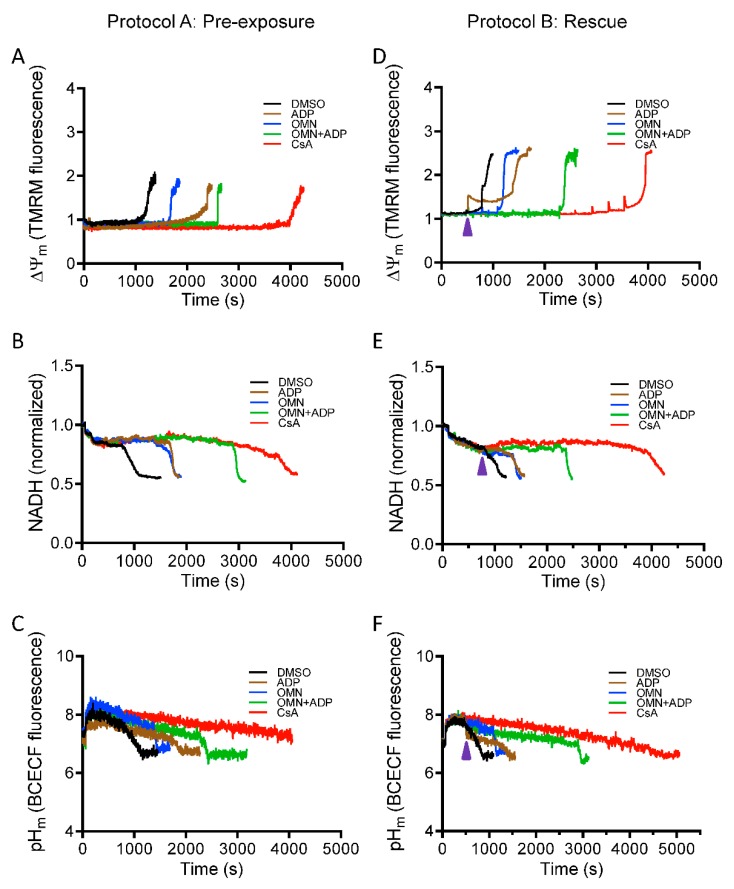
Figure 5.
Effect of CsA and AdN on mitochondrial bioenergetics. The bioenergetic responses during Protocols A (left column) and B (right column) were monitored using the ΔΨm sensitive dye TMRM (tetramethylrhodamine methyl ester perchlorate) (A,D), NADH autofluorescence (B,E), and pHm-sensitive dye BCECFAM (2′,7′-Bis-(2-Carboxyethyl)-5-(and-6)-carboxyfluorescein, acetoxymethyl ester AM) (C,F). Purple arrowhead indicates time of addition of DMSO (1 µM), ADP (250 µM), OMN (10 µM), OMN+ADP, or CsA (0.5 µM) during Protocol B.

