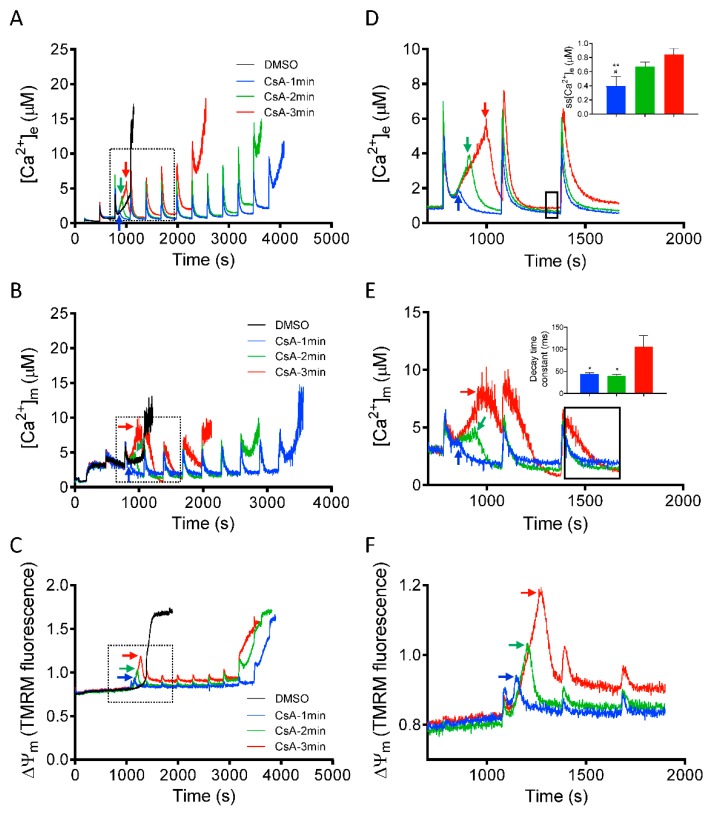
Figure 6.
Time-dependent effects of CsA on mitochondrial Ca2+ dynamics and bioenergetics during rescue of mitochondria from mPTP opening. Changes in (A) extra-matrix free Ca2+ ([Ca2+]e), (B) intra-matrix free Ca2+ ([Ca2+]m) and (C) ΔΨm, when CsA was added at 1 min (blue trace), 2 min (green trace), and 3 min (red trace) after the last Ca2+ bolus before another Ca2+ bolus would have caused mPTP opening. Right panels show the effect of CsA on (D) [Ca2+]e, (E) [Ca2+]m, and (F) ΔΨm dynamics during rescue of mitochondria from mPTP opening in greater detail. Insets (D,E) show relative ss[Ca2+]e and decay time constant (ms) at specified time points (black dotted box), respectively. Arrows indicate time of addition of CsA (0.5 µM). Error bars represent mean ± SEM (* p < 0.05, ** p < 0.01 vs. 3 min and # p < 0.05 vs. 2 min).

