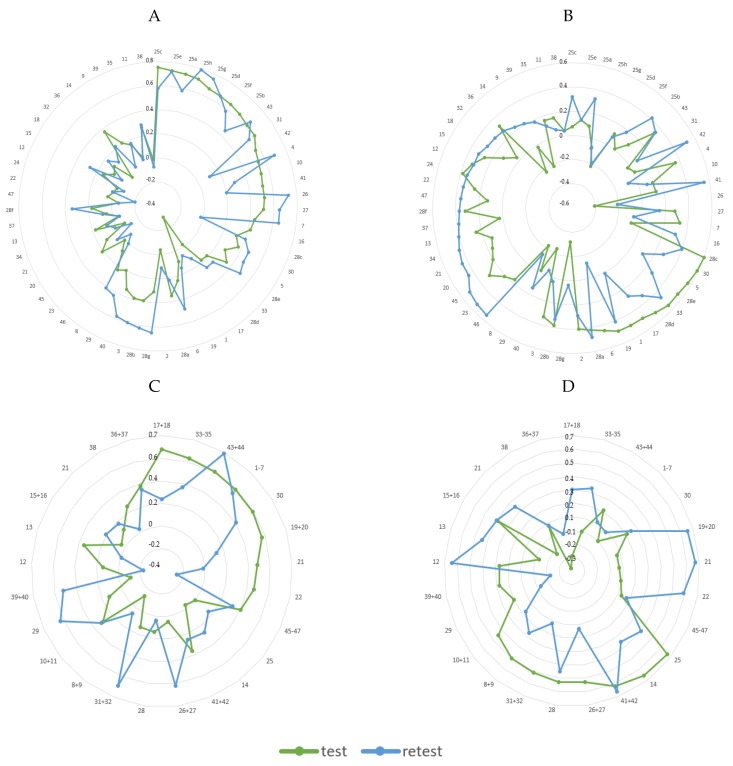
Figure 1.
Diagrams with factor loadings of dietary patterns identified in the total sample from a different number of food items in the test and the retest: (A) 60-item-DP1, (B) 60-item-DP2, (C) 25-item-DP1, (D) 25-item-DP2. The numbers correspond to food items: 1–sugar; 2–honey; 3–chocolates; 4–sugar confectionery; 5–baked confectionery; 6–ice-creams and custard; 7–savory snacks; 8–milk and milk beverages—natural; 9–cheese curds; 10–milk beverages—sweetened; 11–flavored cheese curds; 12–cheese; 13–eggs and egg dishes; 14–breakfast cereals; 15–whole meal cereals; 16–coarse groats; 17–refined cereals; 18–fine groats; 19–butter; 20–cream; 21–other animal fats; 22–vegetable-based oil; 23–margarine; 24–mayonnaise; 25–all kinds of fruits; 25a–stone fruit; 25b–kiwi and citrus fruit; 25c–tropical fruits; 25d–berries; 25e–bananas; 25f–apples and pears; 25g–avocado; 25h–olives; 26–dried fruit; 27–fruit preserves and fruit condiments; 28–all kinds of vegetables (potatoes not included); 28a–cruciferous vegetables; 28b–yellow-orange vegetables; 28c–leafy green vegetables; 28d–tomatoes; 28e–gourds and squashes; 28f–root vegetables and others; 28g–fresh and tinned legumes; 29–dry and processed pulses; 30–potatoes; 31–nuts and nut spreads; 32–seeds and bran; 33–sausages, bacon, reconstituted meat; 34–high-quality cured meats; 35–offal products; 36–red meat; 37–venison; 38–poultry and rabbit; 39–lean fish; 40–oily fish; 41–fruit juices and nectars; 42–vegetable and vegetable-fruit juices; 43–sweetened beverages; 44–energy drinks; 45–beer; 46–wine and cocktails; 47–spirits.

