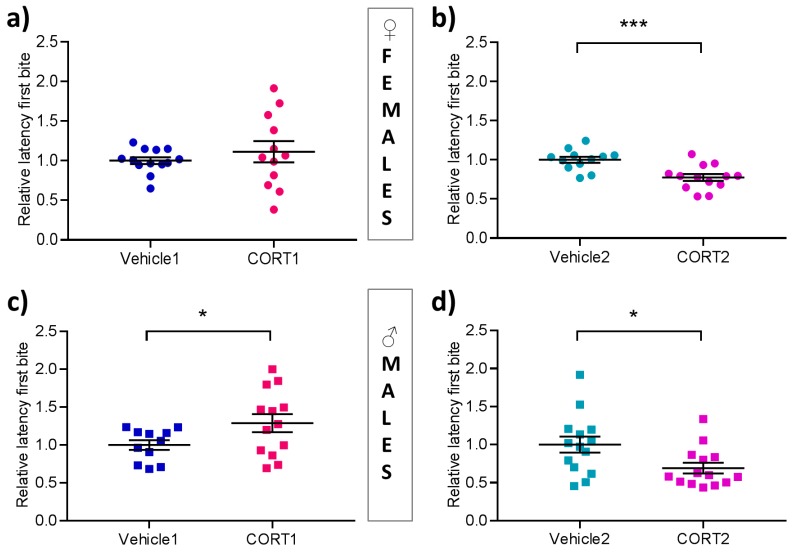
Figure 3.
Novelty Suppressed Feeding test in CORT treated and control mice. Behavioral outcome of the novelty suppressed feeding test showing relative latencies until the first bite in (a–b) female (c–d) male mice of each CORT and Vehicle group. All values are presented as mean ± SEM (n = 11–14 per group). Statistical significances are results of Student‘s t-test. * p < 0.05, *** p < 0.001.

