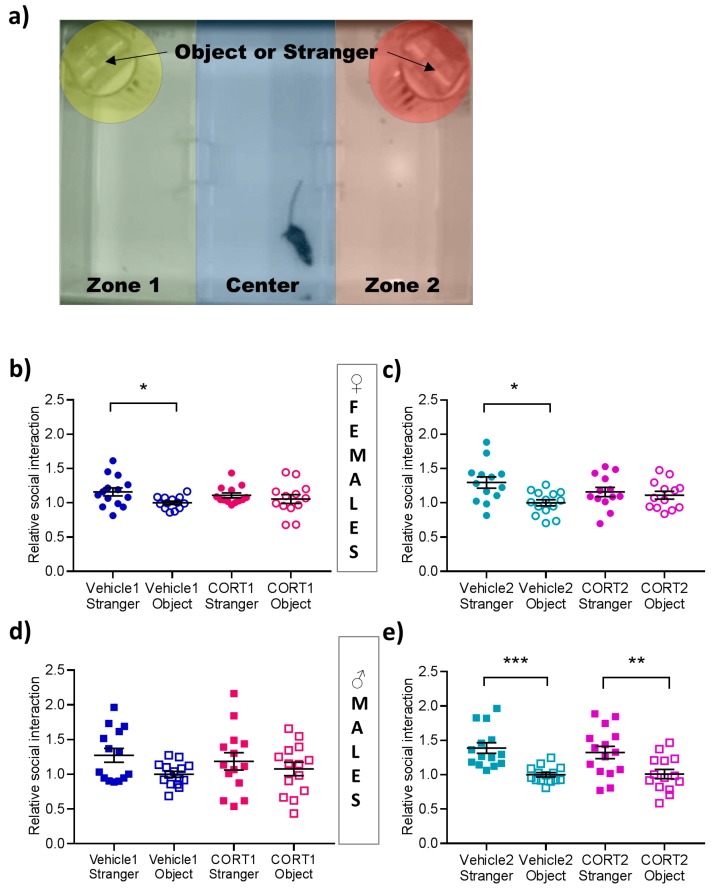
Figure 4.
Social Interaction test in CORT mice. (a) Experimental design and behavioral results of social interaction test in (b–c) female and (d–e) male CORT treated and Vehicle control mice. All values are presented as mean ± SEM (n = 13–15 per group). Statistical significances displayed results of posthoc pairwise comparison after repeated measure ANOVA. * p < 0.05, ** p < 0.01, *** p < 0.001.

