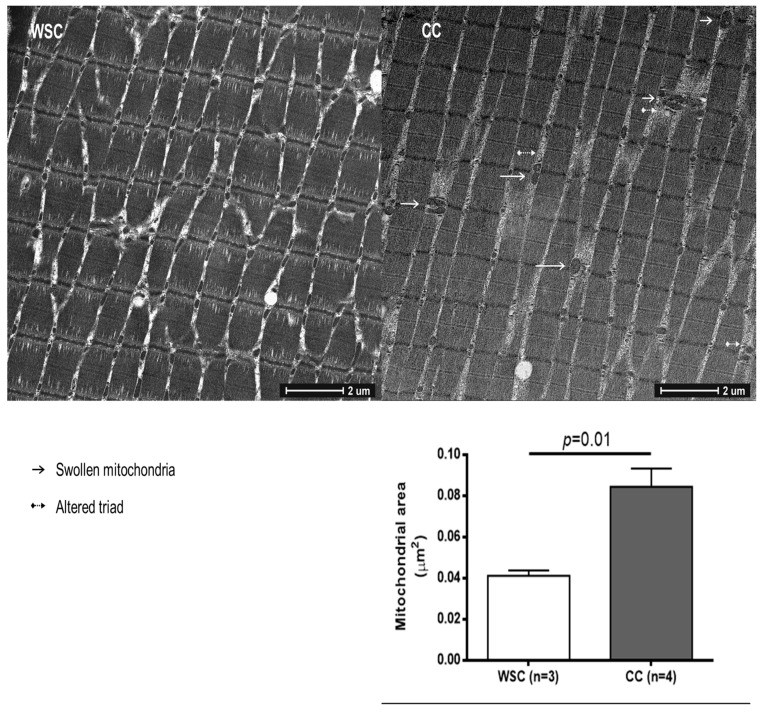
Figure 1.
Skeletal muscle photomicrograph and intermyofibrillar mitochondrial area of WSC and CC. Image J software was used to assess mitochondrial area (WSC, n = 3; CC, n = 4). Mitochondrial area was compared using Student’s t test and data are expressed as mean and standard error. WSC—weight-stable cancer patients; CC—cachectic cancer patients.

