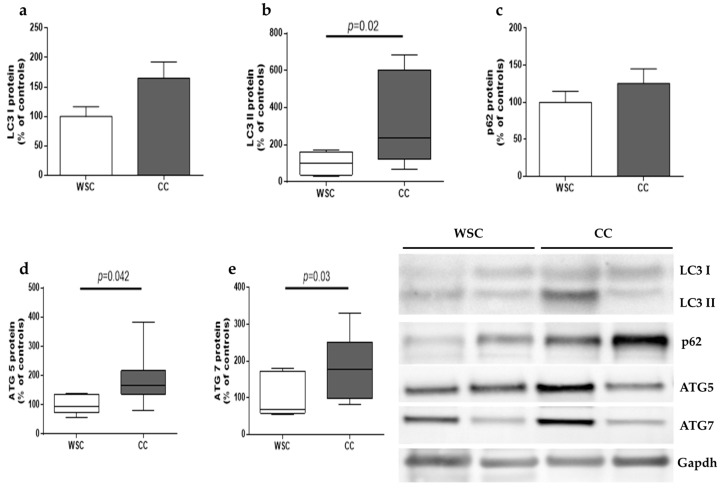
Figure 3.
Autophagy-related proteins in skeletal muscle of WSC and CC patients. Western blot analysis of (a) LCB3 I (WSC, n = 8; CC, n = 10); (b) LC3B II (WSC, n = 8; CC, n = 10); (c) p62 (WSC, n = 8; CC, n = 10); (d) ATG5 (WSC, n = 6; CC, n = 8) and (e) ATG7 (WSC, n = 6; CC, n = 8). Data are expressed as mean and standard error and were compared using Student’s t test or were represented in box plots and compared using Mann–Whitney test. WSC—weight-stable cancer patients; CC—cachectic cancer patients.

