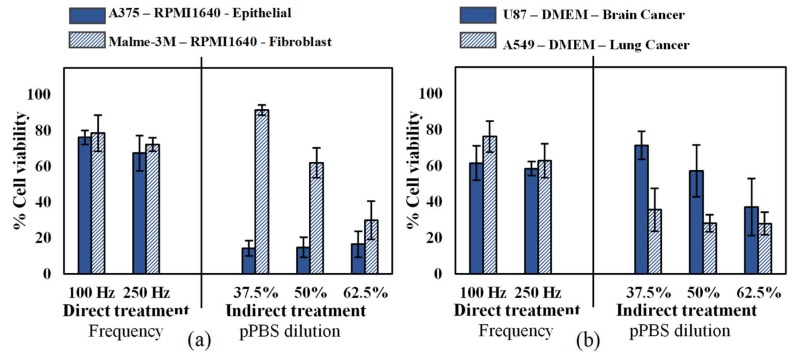
Figure 1.
Analysis of the influence of the cell type and cancer type on both direct treatment (FE-DBD at two different frequencies) and indirect treatment (pPBS in three different dilutions). (a) Comparison of an epithelial cell line (A375) with a fibroblast cell line (Malme-3M), which are both skin cancer cell lines. (b) Comparison of a brain cancer cell line (U87) with a lung cancer cell line (A549). For both figures, the cells were cultured in the same cell culture medium and treated with exactly the same conditions. Therefore, the only variables tested were (a) cell type and (b) cancer type. Data are represented as mean ± standard deviation (SD) of three independent experiments with at least two replicates. Statistical significance of all treatment conditions was compared to untreated. *p < 0.05, **p < 0.01, and ***p < 0.005 (one-way ANOVA).

