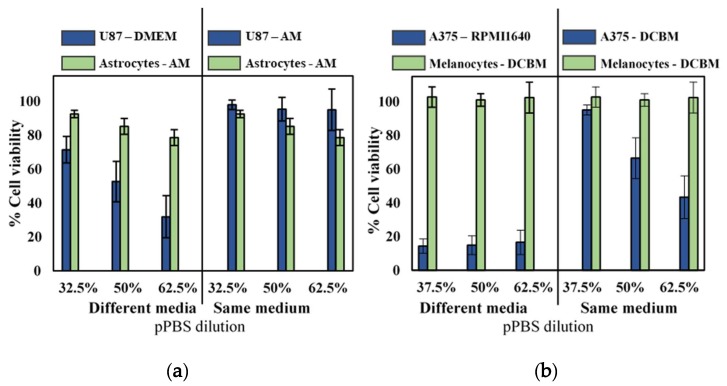
Figure 3.
Analysis of the selectivity with the indirect treatment for brain cancer and skin cancer. A 5-min treatment with a gas flow rate of 1 slm and a gap of 6 mm was used to create the pPBS, which we further diluted. Comparison of (a) brain and (b) skin cancer cells in their common medium (blue solid bars on the left side) with non-cancerous cells in their common medium (green solid bar on the left side) appeared to show selectivity in all cases. However, when compared to the cancer cells in the advanced media (on the right side of the graph), the selectivity was not found. Hence, this clearly shows that the selectivity was affected by the cell culture medium. This is important to realize, to avoid drawing false conclusions. Data are represented as mean ± standard deviation (SD) of three independent experiments with at least two replicates. Statistical significance of all treatment conditions was compared to untreated. *p < 0.05, **p < 0.01, and ***p < 0.005 (one-way ANOVA).

