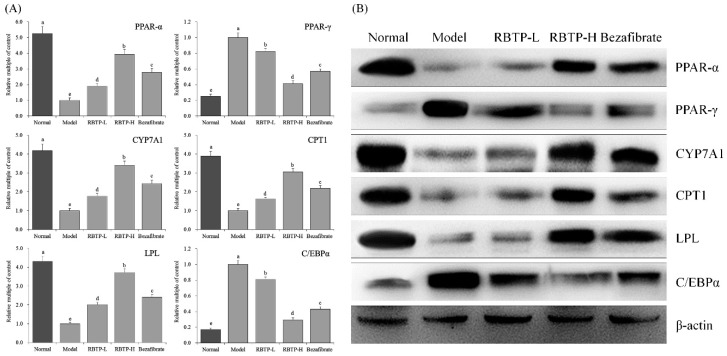
Figure 6.
The PPAR-α, PPAR-γ, CYP7A1, CPT1, LPL, and C/EBPα mRNA (A) and protein (B) expression in hepatic tissue of mice. a–e Mean values with different letters in the bar are significantly different (p < 0.05) according to Duncan’s multiple-range test. RBTP-L: mice treated with low concentrations of polyphenols of raw Bowl tea (50 mg/kg); RBTP-H: mice treated with high concentrations of polyphenols of raw Bowl tea (100 mg/kg); Bezafibrate: mice treated with bezafibrate (100 mg/kg).

