Figure 3.
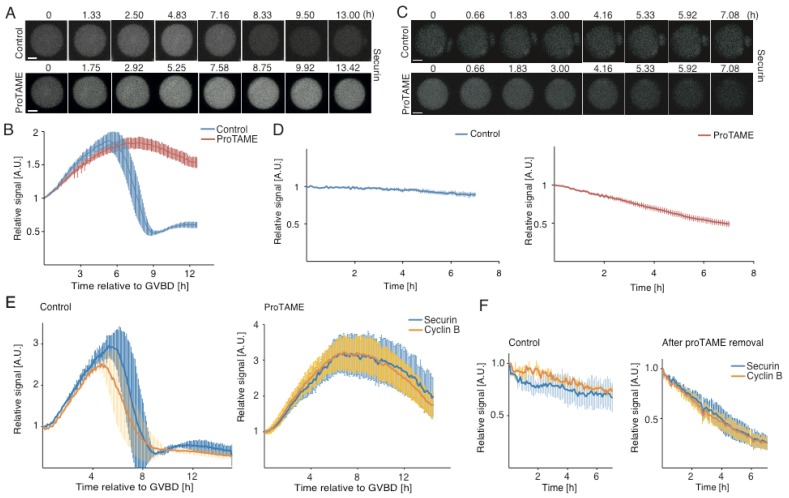
Oocytes arrested by proTAME show a low level of anaphase promoting complex/cyclosome (APC/C) activity. (A) Time frames from live cell microscopy showing the expression levels of microinjected SECURIN (grey) in various stages of meiotic maturation. Upper panels show the control cell, lower panels show the oocyte exposed to 5 μM proTAME. Scale bar: 20 μm. (B) Average SECURIN curves of control cells (blue, n = 5) and proTAME-treated cells (red, n = 11) with error bars. Time is relative to GVBD (a movie frame with GVBD or the first frame after GVBD represents time 0). Presented are representative results from a single experiment, which was repeated three times. (C) Time frames from live cell microscopy showing expression levels of microinjected SECURIN (grey) after the removal of proTAME from the culture media. Upper panels show the control cell, lower panels show cells previously exposed to 5 μM proTAME. Scale bar: 20 μm. (D) The left panel shows the average SECURIN curve with error bars of control cells (blue, n = 5) after proTAME removal; the right panel shows the average SECURIN curve with error bars of proTAME-treated cells (red, n = 11) after the removal of proTAME. The time is relative to the first frame after the removal of the inhibitor. Presented are representative results from a single experiment, which was repeated three times. (E) The left panel shows the average SECURIN (blue, n = 3) and CYCLIN B (yellow, n = 3) curves of control cells with error bars; the right panel shows the average SECURIN (blue, n = 6) and CYCLIN B (yellow, n = 8) curves of proTAME-treated cells with error bars. Time is relative to GVBD. Presented are results from a single experiment repeated twice. (F) The left panel shows the average SECURIN (blue, n = 3) and CYCLIN B (yellow, n = 2) curves of control cells, from the time point corresponding to proTAME removal, with error bars; the right panel shows the average SECURIN (blue, n = 6) and CYCLIN B (yellow, n = 7) curves of proTAME-treated cells after the removal of proTAME with error bars. Time is relative to the first frame after the removal of inhibitor. Presented are results from a single experiment; the experiment was repeated twice.

