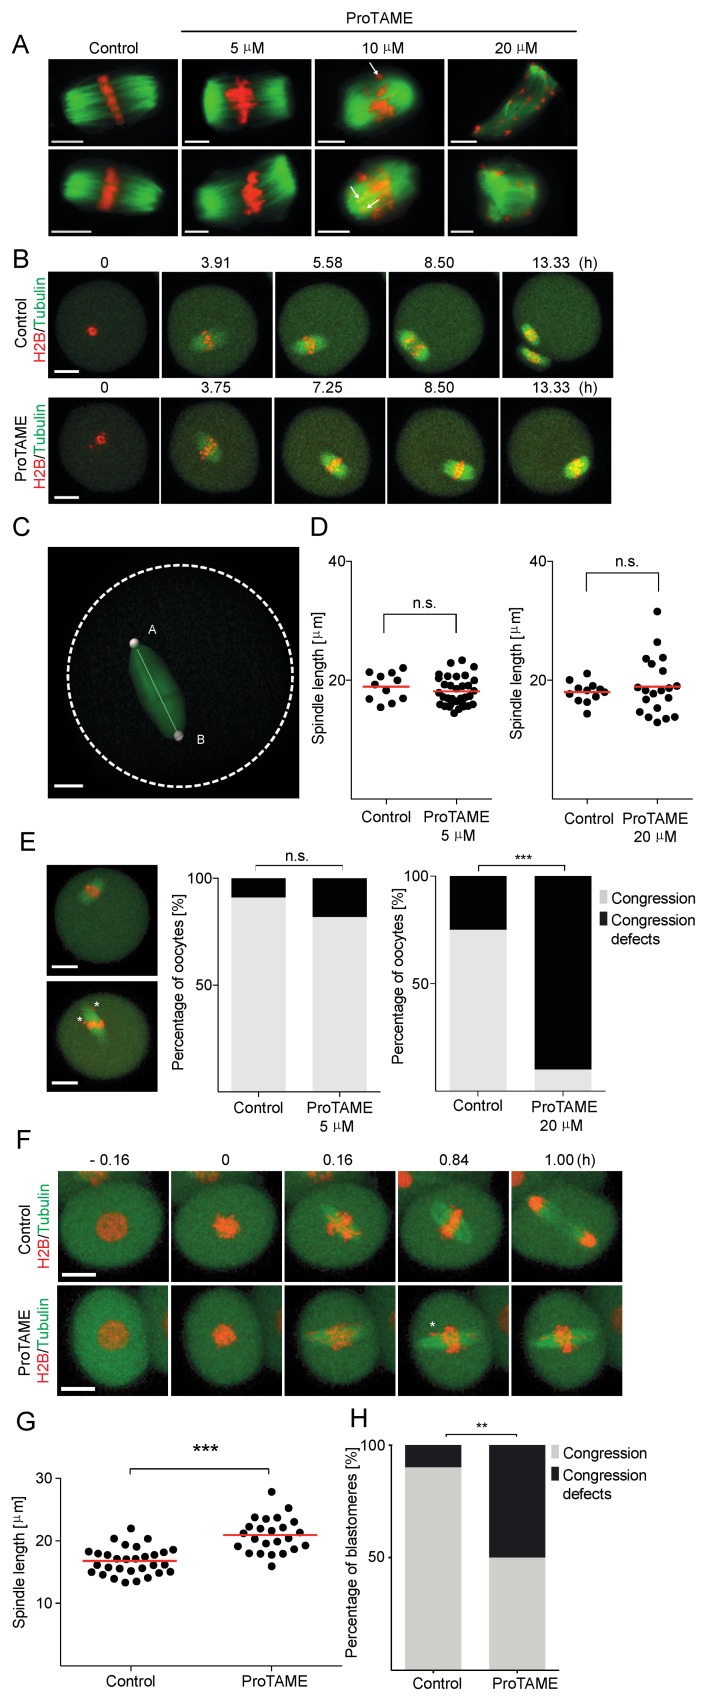
Figure 6.
Effect of proTAME exposure on spindle morphology in mouse oocytes and mouse two-cell embryos. (A) Examples of spindle morphology of control oocytes and oocytes treated with 5, 10 and 20 μM proTAME. TUBULIN (green) was detected with an antibody recognizing acetylated TUBULIN, and DNA (red) was visualized with DAPI. Chromosomes separated from the metaphase plane are indicated by an arrowhead. Scale bar: 10 μm. (B) Time frames from a live cell imaging experiment of oocytes microinjected with TUBULIN (green) and HISTONE H2B (red) ORFs fused to fluorescent proteins. Upper frames show the control oocyte, the lower panel shows the oocyte cultured in 5 μM proTAME. Scale bar: 20 μm. (C) The example of spindle length measurement. A movie frame with control oocyte microinjected with TUBULIN (green). Scale bar: 10 μm. (D) The left scatter plot shows the spindle length in control (n = 11) and 5 μM proTAME-treated oocytes (n = 33). Data were obtained in three independent experiments. The difference between the control and 5 μM proTAME-treated cells is not significant (p value = 0.3368). The right scatter plot shows the spindle length in control (n = 12) and 20 μM proTAME-treated oocytes (n = 20). The red line represents the mean. Data were obtained in two independent experiments. The difference between the control and 20 μM proTAME-treated cells is not significant (p value = 0.5291). (E) Movie frames on the left show examples of an oocyte with normal congression (upper panel) or an oocyte with chromosome congression defects (lower panel), scale bar: 20 μm. Congression defects are indicated by asterisks. The left chart shows the frequency of chromosome congression defects in control (n = 11) and 5μM proTAME-treated oocytes (n = 33). A total of 9.09% of control oocytes and 18.18% of oocytes treated with 5 μM proTAME exhibited congression defects. Data were obtained in three independent experiments; the difference between the control group and 5 μM proTAME was not statistically significant (α < 0.05; p = 0.6594). The right chart shows the frequency of chromosome congression defects in control (n = 12) and 20 μM proTAME-treated oocytes (n = 20) with 25.00% of control and 90.00% of proTAME treated oocytes showing congression defects. Data were obtained in two independent experiments; the difference between the control group and 20 μM proTAME was statistically significant (α < 0.05; *** p < 0.001) (F) Time frames from live cell imaging experiment with two-cell stage embryos microinjected with TUBULIN (green) and HISTONE H2B (red) fused to fluorescent proteins. Upper frames show the control embryo, the lower panel shows the embryo cultured in 20 μM proTAME, scale bar: 20 μm. Congression defects are indicated by asterisk. (G) Scatter plot showing spindle length in control blastomeres (n = 30) and 20 μM proTAME-treated blastomeres (n = 24). The difference between the control group and proTAME was statistically significant (α < 0.05; *** p < 0.001). The red line represents the mean. Data were obtained in two independent experiments. (H) Frequency of chromosome congression defects in control (n = 30) and 20 μM proTAME-treated blastomeres (n = 24). A total of 10% of control blastomeres and 50% of blastomeres treated with 20 μM proTAME showed congression defects. The difference between the control group and proTAME was statistically significant (α < 0.05; ** p < 0.010).

