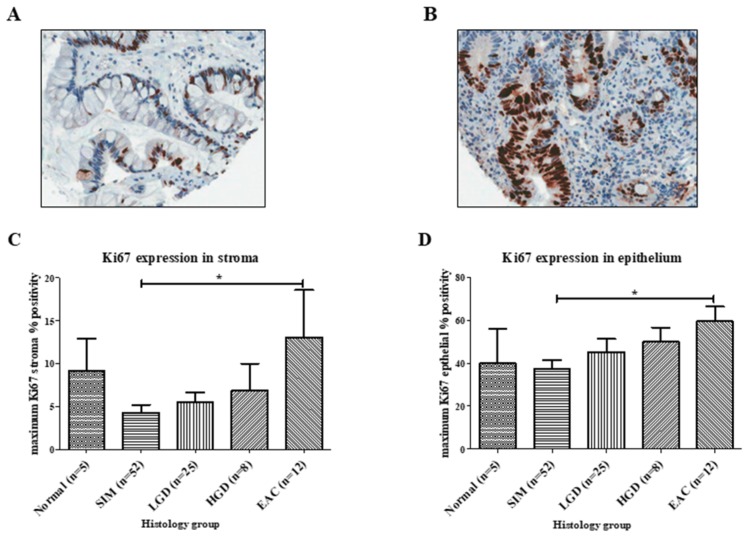
Figure 3.
Ki67 staining across the Barrett’s esophagus disease spectrum. (A) Section of a core of Barrett’s intestinal metaplasia, at magnification 40×, demonstrating no staining of stroma and approximately 40% epithelial staining. (B) Section of a core of esophageal adenocarcinoma, at magnification 40×, demonstrating approximately 75% Ki67 staining in the glandular epithelium. Ki67 staining was significantly increased in the (C) stroma and (D) epithelial cells of esophageal adenocarcinoma patients compared with SIM patients. Error bars represent SEM. * p < 0.05.

