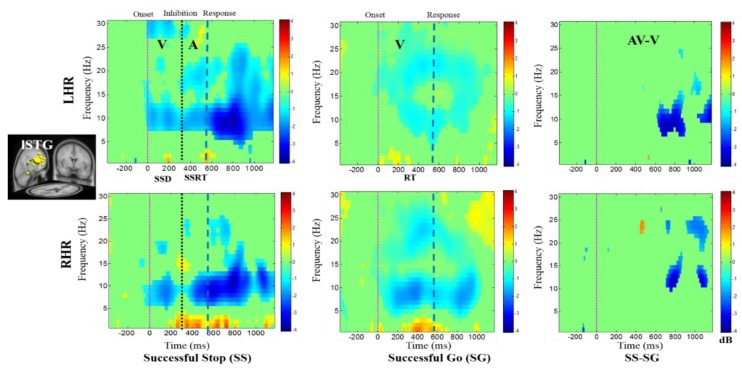
Figure 7.
The ERSP plots showing the post-stimuli modulations in left superior temporal gyrus (lSTG) of the brain under combined visual (V) stimuli and auditory (A) alarms. Purple dashed line: Onset of the visual stimuli; black dashed line: Onset of the auditory alarms; blue dashed line: Onset of response. Color bars show the amplitude of the ERSP; statistical threshold at p < 0.01.

