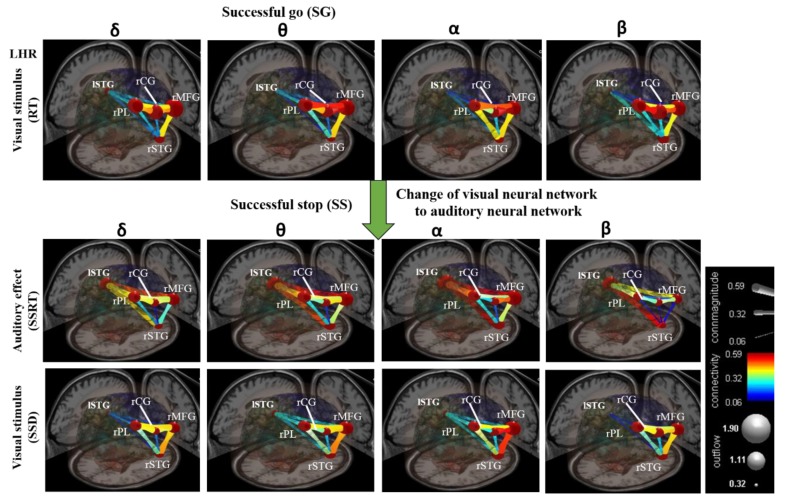
Figure 10.
The design of visual and auditory cross-model neural networks under human inhibitory control of left-hand response (LHR). The neural network between five brain regions, including left superior temporal gyrus (lSTG), right superior temporal gyrus (rSTG), right cingulate gyrus (rCG), right middle front gyrus (rMFG), and right parietal lobe (rPL). The green arrow shows the change of the visual neural network to the auditory neural network. Color bars shows the scale of the connectivity strength; statistical threshold at p < 0.01. The outflow was obtained between two dipole sources. The gray node shows the high and low outflow strength between the two dipoles. Connectivity (edge color mapping): The color of the edges was mapped to connectivity strength (amount of information flow along that edge). Red = high connectivity and green = low connectivity. ConnMagnitude (edge size mapping): The size of edges of the graph (connecting “arrows”) was mapped to connectivity magnitude (i.e., absolute value of connectivity strength).

