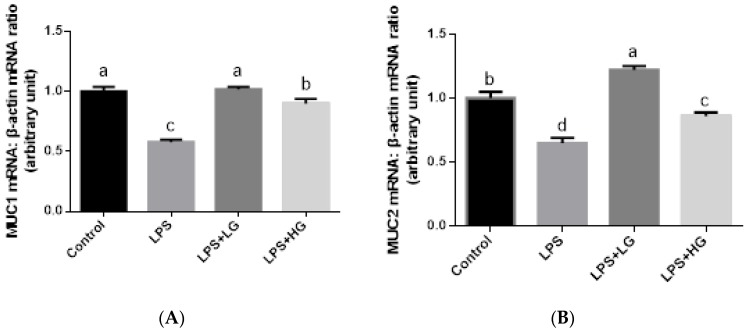
Figure 2.
mRNA expression level of MUC1 and MUC2 in the jejunal mucosa of piglets fed diets with two molecular weight β-glucans. Data are shown as means ± SE. (A) MUC1 mRNA expression level. (B) MUC2 mRNA expression level. Different letters indicate statistically significant differences between groups (p < 0.05). Control: Sterile saline solution injection group fed basal diet; LPS:LPS injection group fed basal diet; LPS + LG:LPS injection group fed low molecular weight β-glucan; LPS + HG:LPS injection group fed high molecular weight β-glucan.

