Figure 2.
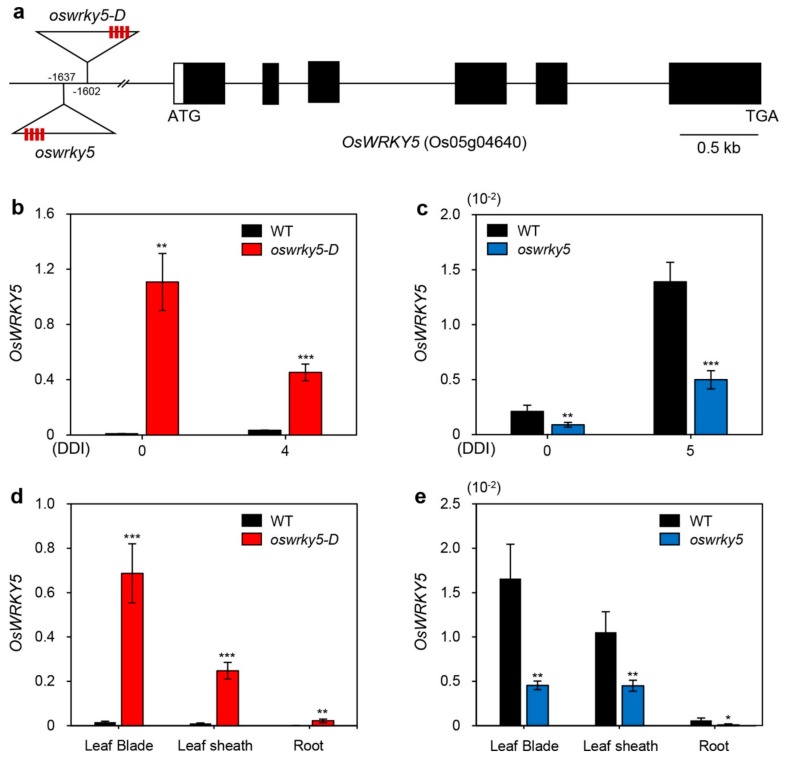
Mutation of OsWRKY5 by T-DNA insertion. (a) Schematic diagram depicting the positions of T-DNA insertions in the promoter region of OsWRKY5 (LOC_Os05g04640). Black and white bars represent exons and 5′-untranslated region, respectively. Open triangles indicate the location of the OsWRKY5 T-DNA insertions (oswrky5-D, PFG_3A-15928; oswrky5, PFG_3A-06060). Red boxes on triangles represent tetramerized 35S enhancers (4 × 35S). (b,c) Total RNA was isolated from detached leaves of WT and mutant lines (oswrky5-D and oswrky5) under DIS as shown in Figure 3a,b. (d,e) OsWRKY5 mRNA levels were measured in rice tissues separated from three-week-old WT and mutant lines. Transcript levels of OsWRKY5 in oswrky5-D (b,d) and oswrky5 (c,e) were determined by RT-qPCR and normalized to the transcript levels of OsUBQ5. Mean and SD values were obtained from more than three biological replicates. Asterisks indicate a statistically significant difference from WT, as determined by Student’s t-test (* p < 0.05, ** p < 0.01, *** p < 0.001). DDI, day(s) of dark incubation.

