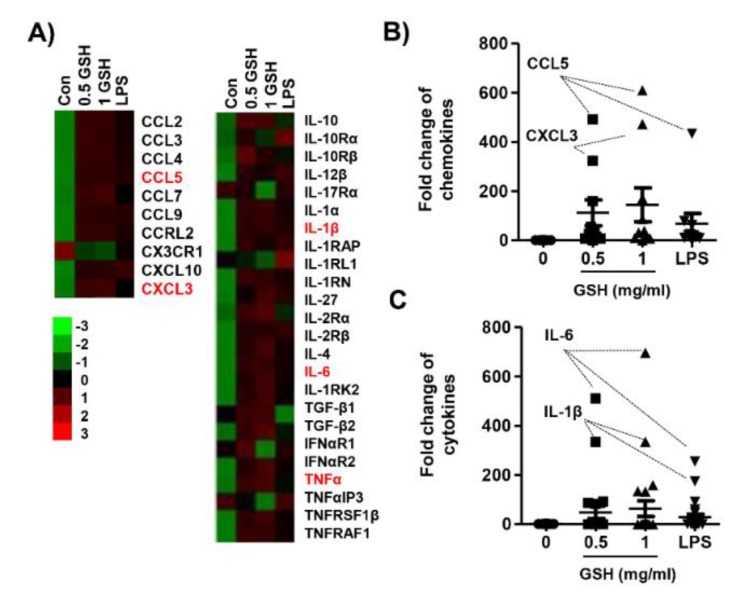
Figure 3.
Heatmap of candidate gene expression for MP using NanoString nCounter® miRNA Expression Assays. The cells were treated with GSH or LPS, and then incubated for 24 h. Total RNA was collected by collecting the cells, and hybridization was performed using a reporter probe and a capture probe. After digital analysis through nCounter nanostring assay (NCT-120), the raw data was normalized using the housekeeping gene, and the gene expression change was represented by the fold change value. (A) Heatmap representing differentially expressed genes with fold-change cutoff of 0.5 and 2 (red and green, respectively). (B) and (C) Expression of each gene was indicated as fold change compared with control. Table 1 shows the abbreviations and designations defined.

