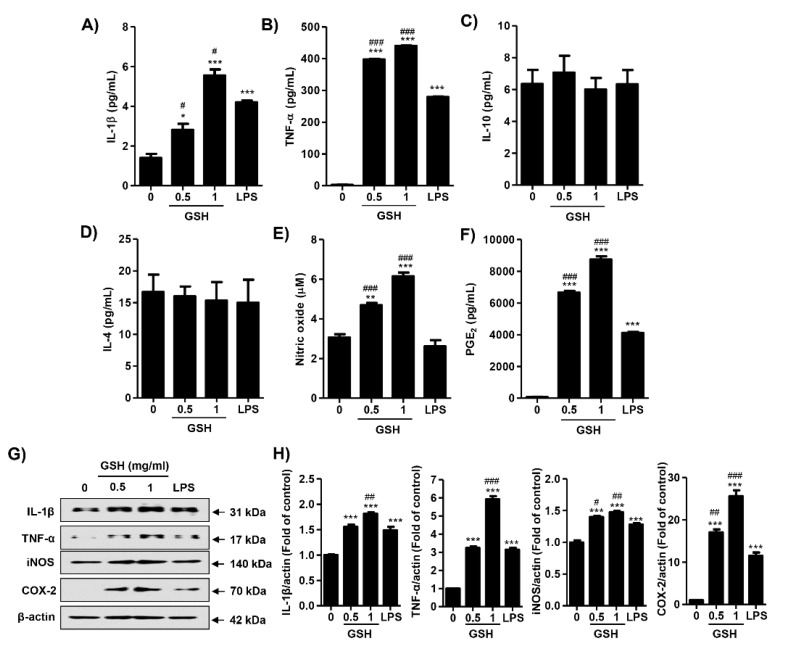
Figure 4.
Effects of GSH on most-potent cytokines, NO and PGE2 production in RAW 264.7 macrophages. Cells were treated with GSH of 0.5 to 1 mg/mL and 1 ng/mL LPS, and then incubated for 24 h. The production of IL-1β (A), TNF-α (B), IL-4 (C) and IL-10 (D) on cell supernatant were measured by ELIAS kits. (E) The amounts of NO were measured using the Griess reagent in culture supernatant. (F) The levels of PGE2 were measured by an ELIAS kit. (G) The cell lysates were immunostained for IL-1β, TNF-α, iNOS, and COX-2. Actin was used as an internal control. Images of the membranes were photographed with the Fusion Fx image acquisition system. (H) Relative band density was measured by ImageJ. All data are expressed as the mean ± SD (n = 3). The statistical analyses were conducted using analysis of variance (ANOVA-Tukey’s post hoc test) between groups. * p < 0.05 ** p < 0.01 and *** p < 0.001 indicates significant difference compared to the non-treated control group. # p < 0.05, ## p < 0.01 and ### p < 0.001 when compared to LPS treatment.

