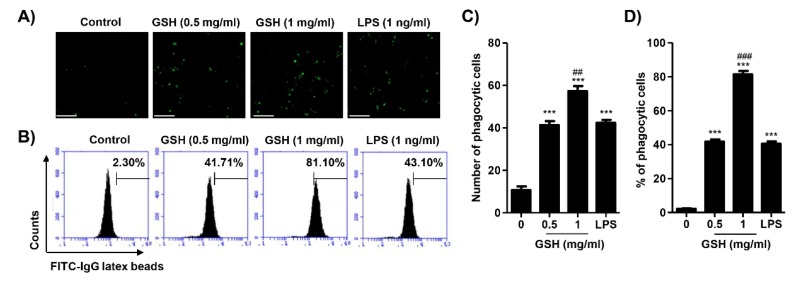
Figure 5.
Effects of GSH on phagocytosis activity in RAW 264.7 macrophages. Cells were treated with GSH of 0.5 to 1 mg/mL and 1 ng/mL LPS, and for 24 h. (A) The phagocytosis activity was visualized by fluorescence microscopy. Scale bar; 200 μm. (B) The fluorescence intensity was counted and indicated as the number of phagocytic cells per field of view. (C) The phagocytosis capacity of GSH was gauged by flow cytometer. The images shown are representative of at least three independent experiments. (D) The statistical analyses were conducted using analysis of variance (ANOVA-Tukey’s post hoc test) between groups. *** p < 0.001 when compared to control. ## p < 0.01 and ### p < 0.001 when compared to LPS treatment.

