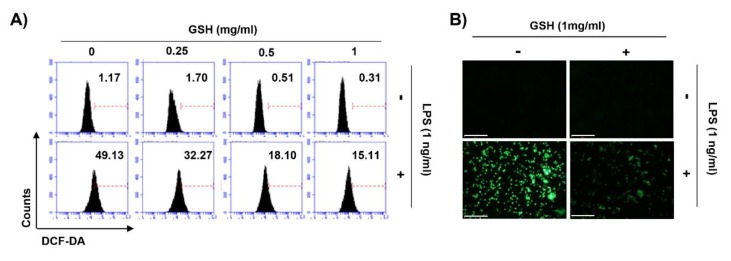
Figure 6.
Effects of GSH on intracellular ROS generation in RAW 264.7 macrophages. Cells were pretreated with various concentrations of GSH for 1 h, and then stimulated with LPS (1 ng/mL) for 6 h. (A) After staining with DCF-DA, DCF fluorescence was monitored by flow cytometer. Results are presented as the means of two independent experiments. (B) Images were obtained by fluorescence microscopy (scale bar; 200 μm). The images shown are representative of at least three independent experiments.

