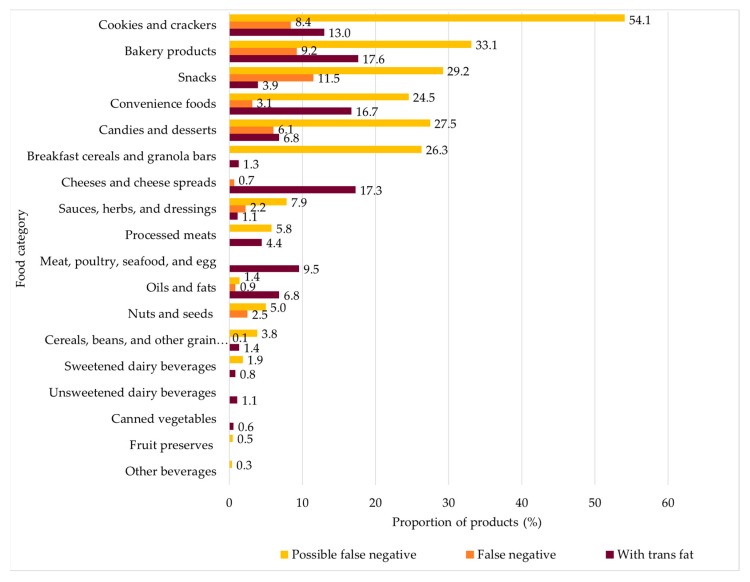
Figure 1.
The proportion of products with trans fat content declared on the nutrition facts panel, false negatives, and possible false negatives by food category. Note: All the products of the sample were classified in the four groups related to the presence of trans fats (n = 11,434). Food categories in which all items were classified in the “without trans fats” group were not shown in this figure.

