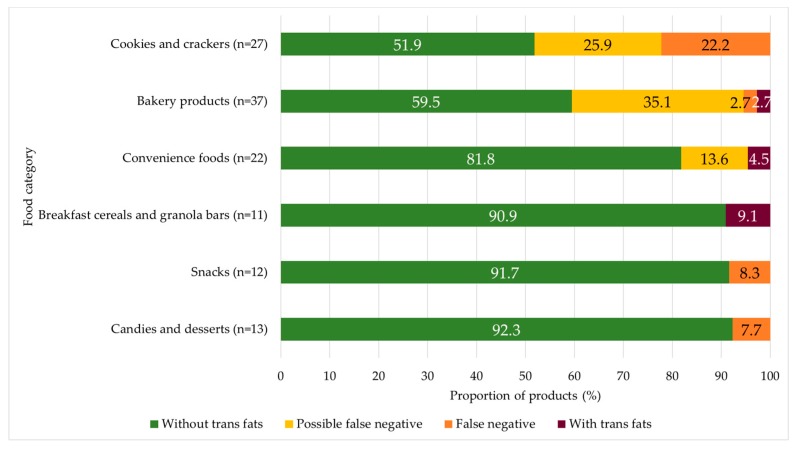
Figure 2.
The proportion of products in the four categories related to the trans fat presence among the products displaying trans fat claims. Note: We displayed the six food categories with the highest proportion of trans fat claims in this figure. In other food categories, products with trans fat claims did not have trans fat ingredients. The exceptions were two products in cereal products (possible false negative) and two products in oils and fats (with trans fats). However, we decided not to show those groups in the figure since the total number of products with claims was very low.

