Figure 5.
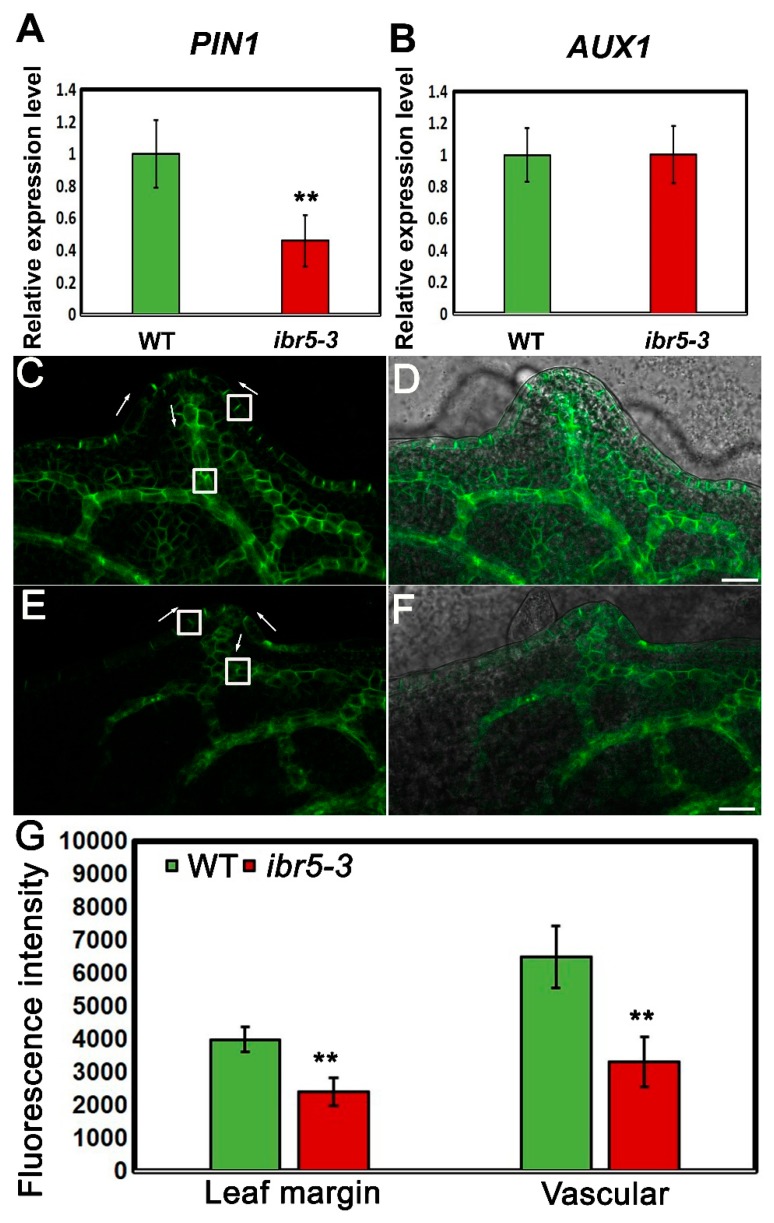
The distribution of PIN1 in the leaf serrations of WT and ibr5-3. (A) The relative expression level of PIN1 in WT and ibr5-3. Error bars are ± SE, n = 3 independent replicates and each with 3 biological replicates analyzed in each assay. (B) The relative expression level of AUX1 in WT and ibr5-3. Error bars are ± SE, n = 3 independent replicates and each with 3 biological replicates analyzed in each assay. (C,D) The representative image of PIN1-GFP in the 10-day-old leaf serrations of WT. Bar, 20 µm. The white boxed regions were used for analysis. The white arrows indicate the direction of auxin transport. (E,F) The representative image of PIN1-GFP in the 10-day-old leaf serrations of ibr5-3. Bar, 20 µm. The white boxed regions were used for analysis. The white arrows indicate the direction of auxin transport. (G) The quantified analysis of the fluorescence intensity of PIN1-GFP in 10-day-old leaf serrations in WT and ibr5-3. Error bars are ± SE, n = 3 independent replicates and each with 12 leaves analyzed in each assay. Two asterisks mean significant differences (p < 0.01 from Student’s t-test).

