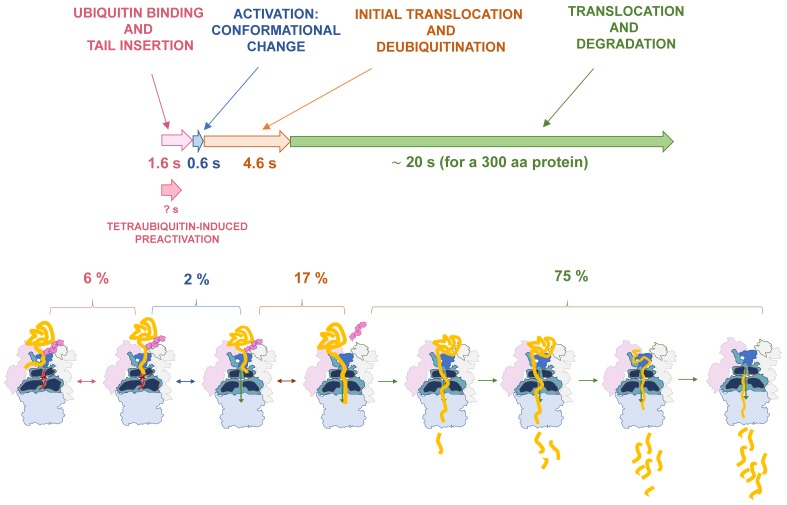
Figure 2.
Dynamic representation of protein degradation by the proteasome. Steps described in the text are shown in different colors, on top, and the information related to each phase is represented in consistent color patterns. Arrows indicate times assigned for each step, based on Bard et al. 2019 [14], adapted to a hypothetical 300 amino acid proteins. The length of the arrows is proportional to estimated times. Percentage numbers indicate the fraction of the total processing time invested in each step. Cartoons representing each step are included below.

