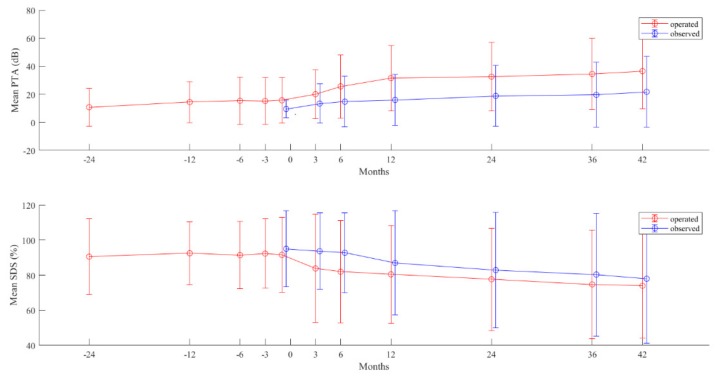
Figure 1.
Time course of hearing deterioration in the 39 operated (red line) and the 20 non-operated (blue line) vestibular schwannoma (VS) in NF2 patients. Pure-tone average (upper figure) and speech discrimination score (lower figure). Values are in mean (points) and standard deviation (bars) of tumors in each group at each measuring time point. Time point 0—time point of surgery and starting point of observation in the non-operated (observed) group.

