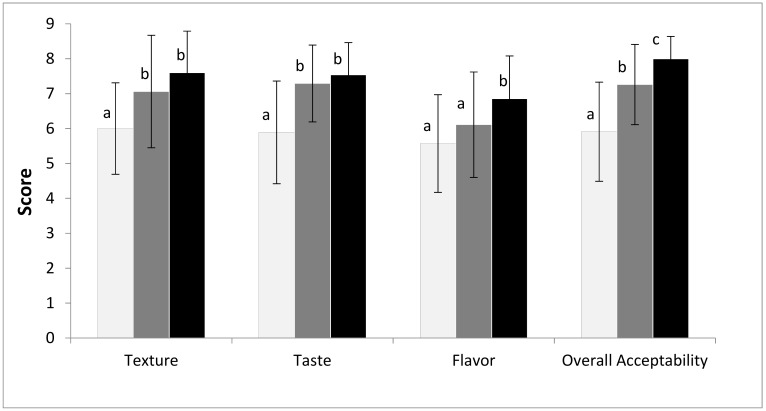
Figure 2.
Results of the acceptability sensory test performed on the CP sample (white bars) and on the SP samples, the latter as blind (grey bars) and informed tests (black bars). Different letters (a, b, c) for the same sensory parameter denote a statistically significant difference between samples at p ≤ 0.05.

