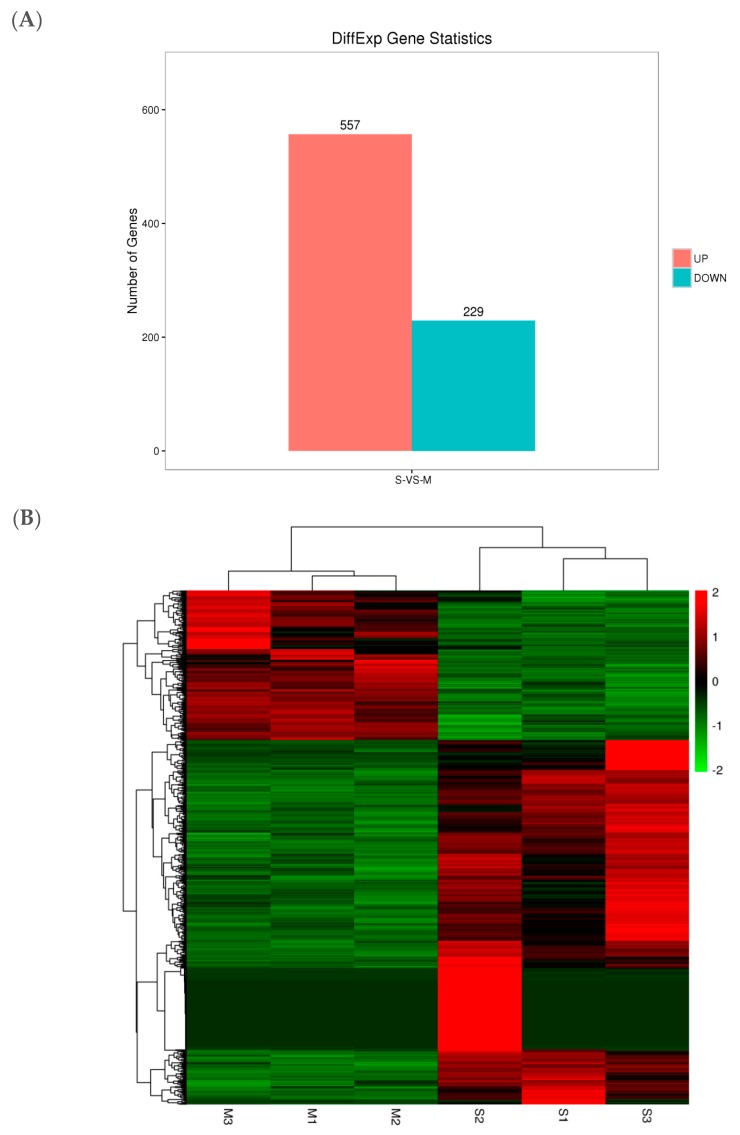
Figure 3.
(A) The statistical maps of DEGs among S-vs-M. (B)The cluster heat maps of DEGs among S-vs-M. The column represents samples, and the row means genes; Color-scaled represents log 2 (fold change) values for resistant lines, the redder the color is, the higher the gene expression is, and on the contrary, the greener color is.

