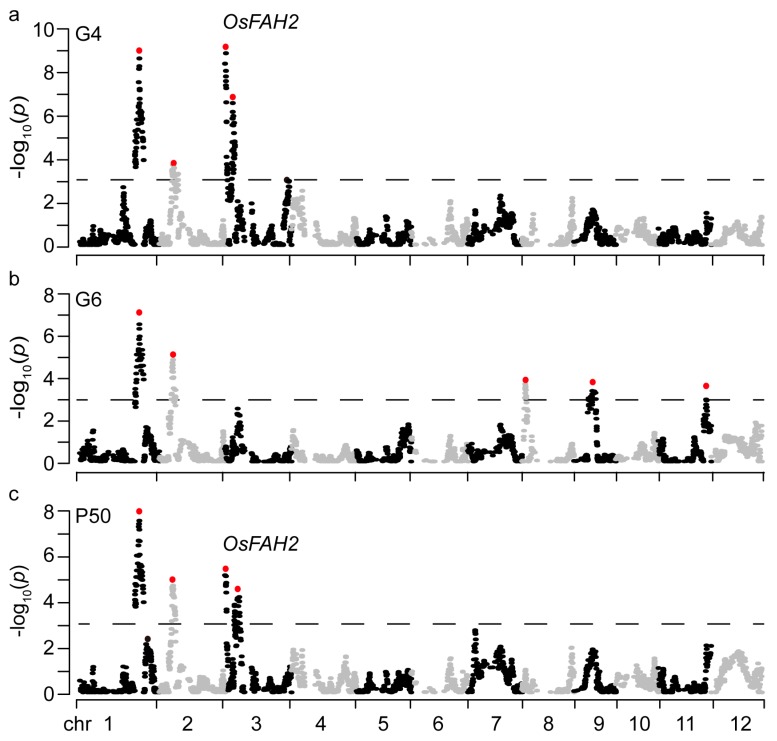
Figure 2.
Manhattan plots of the loci for several parameters of seed storability. G4 at 4-m storage (a); G6 at 6-m storage (b); and P50 (c). The x-axis represents single nucleotide polymorphism (SNP) along each numbered chromosome; the y-axis represents the negative logarithm of the p value (-log10 p) for the SNP association. Horizontal dashed lines in the plots indicate the declaration thresholds. The main quantitative trait loci (QTLs) are highlighted by red dots.

