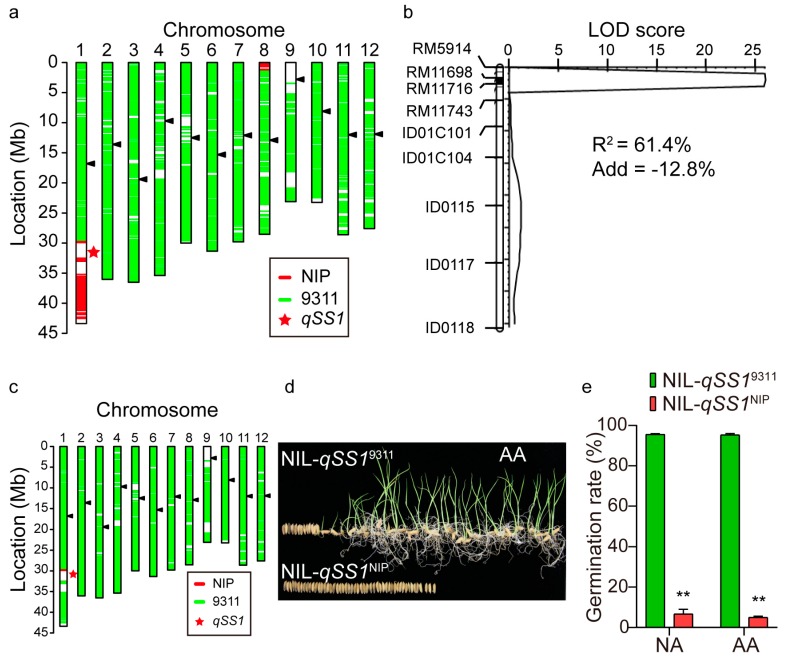
Figure 3.
Validation of qSS1. (a) Graphic genotype of one line that carries an introduced NIP segment encompassing qSS1. Arrowhead (black) indicates centromeric region. (b) qSS1 is narrowed down to the interval flanked by the markers RM11698 and RM11716 using a derived F2 population (n = 128). (c) Graphic genotype of NIL-qSS19311. (d, e) Seed germination of NIL-qSS19311 and NIL-qSS1NIP after natural aging and artificial aging. NA and AA denote natural aging and artificial aging, respectively. Double asterisks in (e) indicate significant difference between NILs at p < 0.01.

