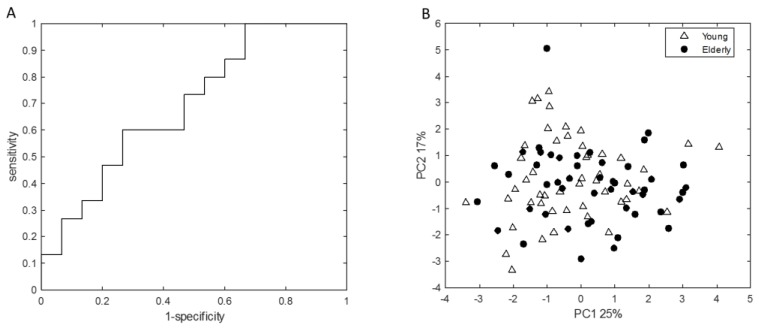
Figure 3.
(A) Receiver operating characteristic curve performed on the validation set, with area under the curve = 0.70. (B) Principal Component Analysis (PCA) score plot, performed on a set of 15 VOCs that were found important (set of the most discriminatory volatile organic compounds (VOCs) selected in at least 80% of RF iterations) for classification in the Random Forest (RF) model, showing no clear groupings in exhaled breath profiles between young adults and elderly. Percentages given at both axes indicate percentage of variation explained by either principal component.

