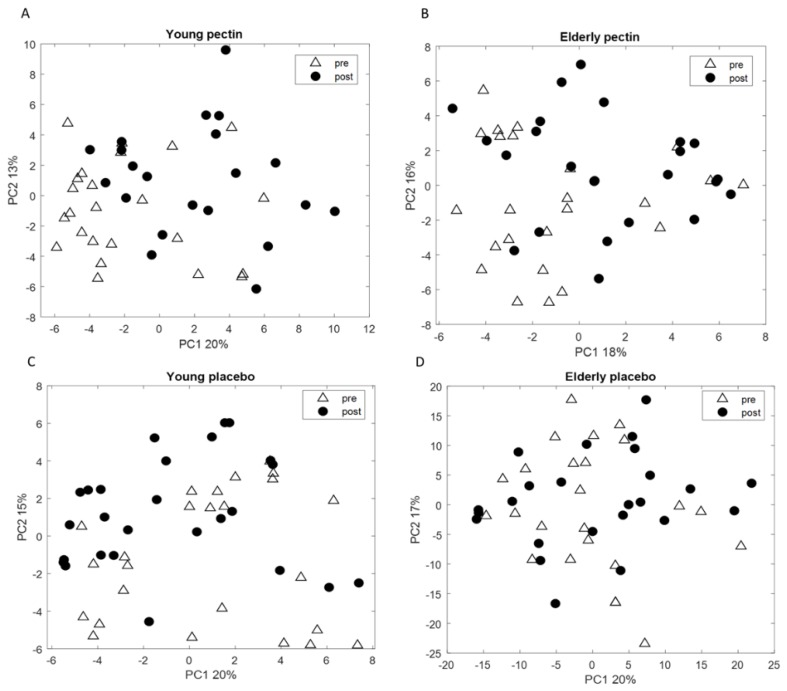
Figure 5.
PCA score plot based on the set of (A) 11 volatile metabolites in the exhaled breath of young adults to discriminate between pre and post-pectin intervention; (B) 12 volatile metabolites in the exhaled breath of elderly to discriminate between pre and post-pectin intervention. PCA score plots performed on the set of 14 VOCs measured in exhaled breath of (C) young adults; and on 16 VOCs measured in exhaled breath of (D) elderly; for pre- and post-placebo intervention. No groupings of the samples are observed. Discriminatory VOCs were selected in at least 80% of RF iterations.

