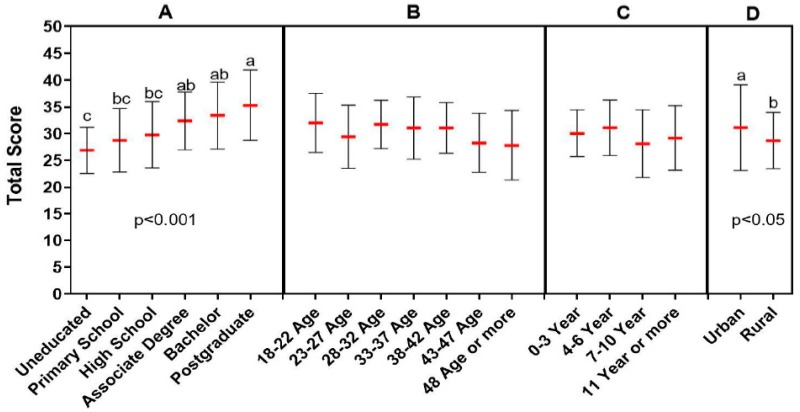
Figure 2.
Association between antibiotic knowledge level and demographic data (A: educational status, B: age, C: the time spent as farmer, D: place of residence). Each demographic data group was analyzed independently. The red lines indicate the mean value and the error bars indicate the standard deviation. Lower case letters (a, b, c) above the groups indicate statistical difference between the groups that is p < 0.05 and p < 0.001.

