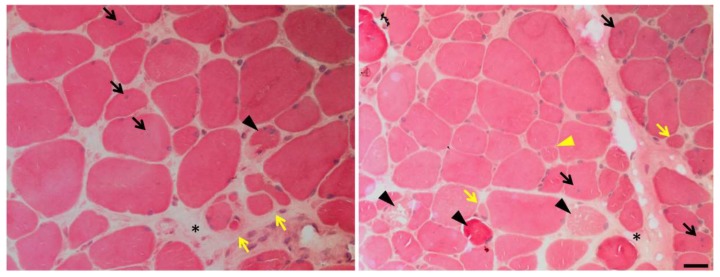
Figure 3.
Muscle biopsy of a LGMDR1 patient. Hematoxylin and eosin staining shows endomysial fibrosis (black asterisks), central nuclei (black arrows), fiber splitting (yellow triangle), necrosis (black triangles), atrophic fibers (yellow arrows) and increased variation in fiber size and shape. Scale bar: 25 μm.

