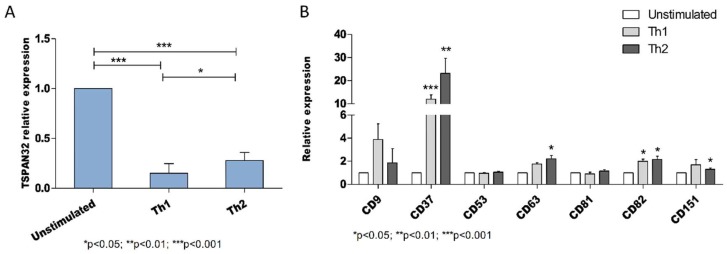
Figure 3.
Expression of tetraspanins in human T cell polarization. (A) Expression of TSPAN32 was evaluated by real-time PCR in polarized Th1 and Th2 cells and unstimulated cells (n = 3 independent replicates). (B) Expression of CD9, CD37, CD53, CD63, CD81, CD82 and CD151 in polarized Th1 and Th2 cells and unstimulated cells as evaluated by real-time PCR (n = 3 independent replicates). Data are shown as normalized mean ± SD and statistical analysis performed using one-way ANOVA followed by Bonferroni multiple test correction.

