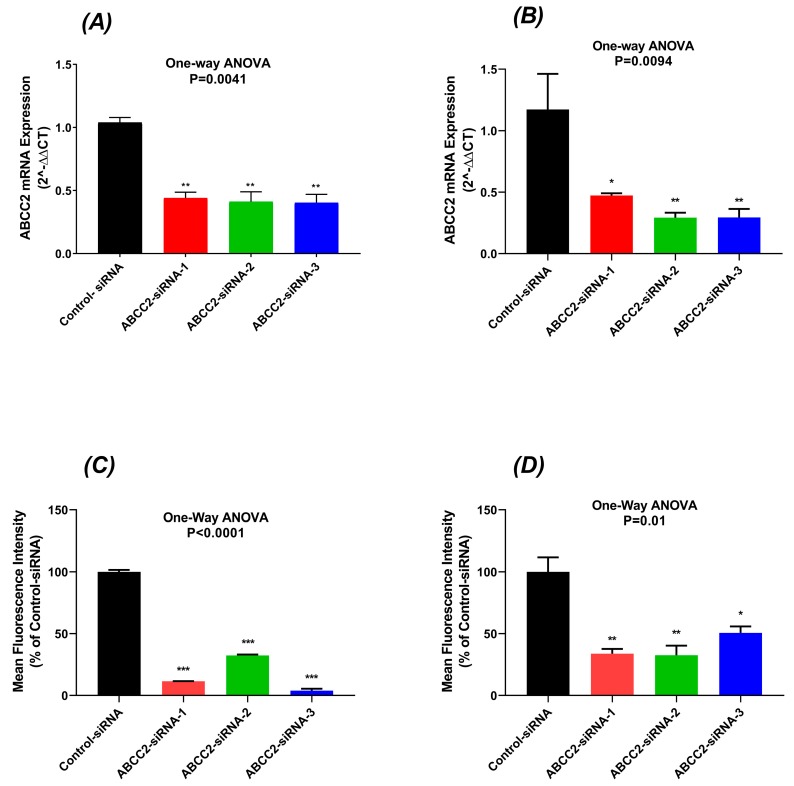
Figure 2.
ABCC2 expression level at mRNA level in Caco-2 (A) and PANC-1 cells (B) transfected with control and ABCC2-siRNAs. Relative ABCC2 mRNA expression was detected by quantitative real-time PCR. ABCC2 mRNA expression was normalised to the reference gene GAPDH and relative quantitation of gene expression was calculated using the comparative threshold cycle method (2−ΔΔCT). All data were expressed as mean and standard errors of the mean from three independent experiments. The cell surface protein expression of MRP2 is presented as a mean percentage of control in (C) Caco-2 and (D) PANC-1 cells. The bar represents the mean and standard errors of the mean values from at least three independent experiments. Asterisks are p values (*, p < 0.05; **, p < 0.01; ***, p < 0.001) from Dunnett’s post hoc test that followed one-way ANOVA for comparisons of all ABCC2-siRNA samples to the negative control.

