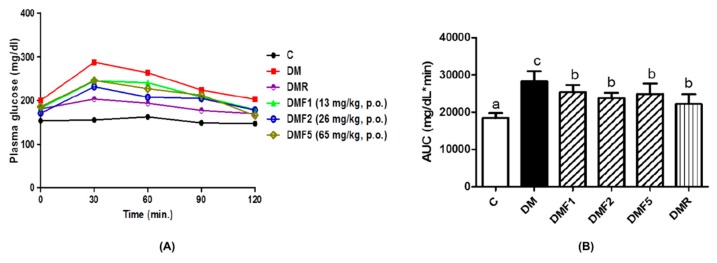
Figure 2.
Effects of fucoxanthin on plasma glucose after treatment for four weeks. (A) Oral glucose tolerance test (OGTT) and (B) area under the curve (AUC) of plasma glucose. Data are shown as the mean ± S.D. (n = 5). The values with different letters (a–c) represent significant differences (p < 0.05) as analyzed by Duncan’s multiple range test. C, control; DM, diabetes; DMF, diabetes treated with fucoxanthin; DMR, diabetes treated with rosiglitazone.

