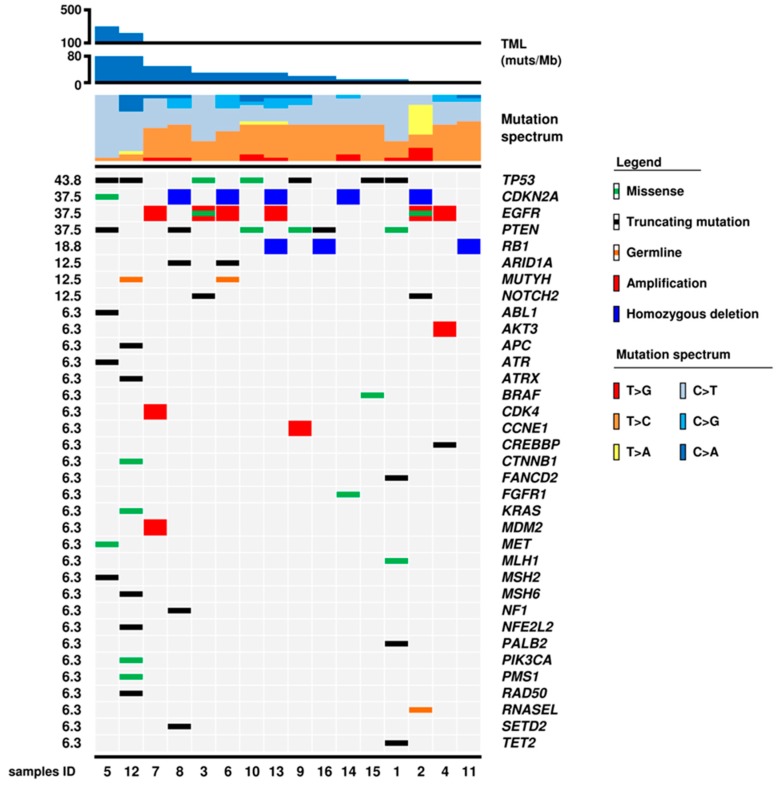
Figure 2.
Genomic landscape of 16 IDH-wt glioblastomas. The matrix shows 36 genes that were altered at sequencing analysis; molecular alterations are annotated as illustrated in the panel below. Samples are ordered according to tumour mutational load (TML) from higher to lower values. The mutational spectrum is characterized by prevalent T > C and C > T transitions with low to absent contributions of T > A, T > G, C > G, and C > A transversions. The proportion of C > T over T > C increased in parallel with the increase of TML. Case 12 GL also showed a significant proportion of C > A transversions.

