Figure 4.
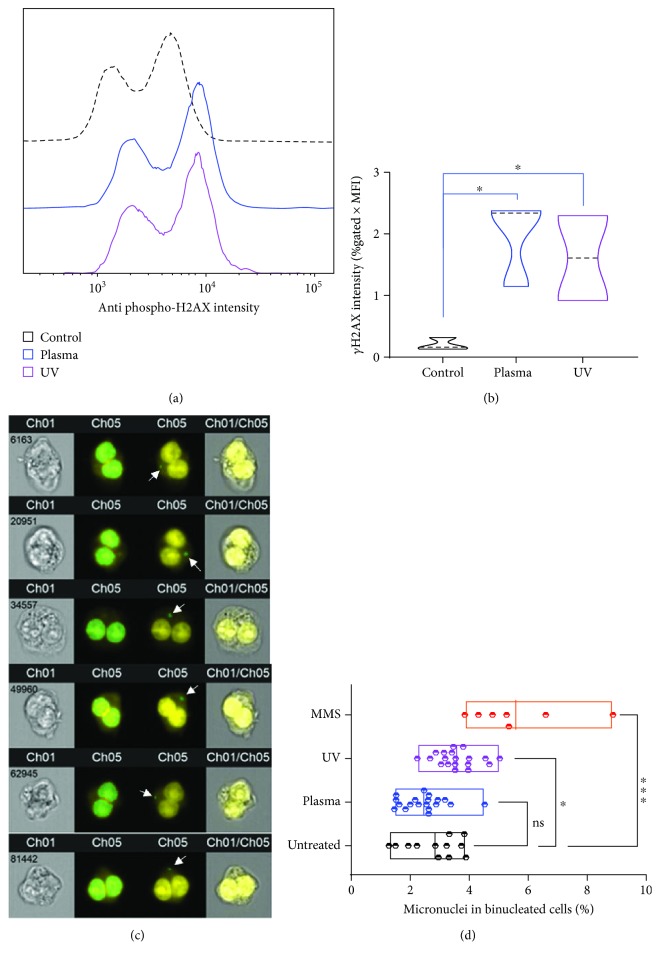
Correlation of γH2AX expression and micronuclei formation. (a, b) Representative histogram overlay γH2AX fluorescence (a) and its quantification (b) in control as well as plasma and UV-treated cells. (c) Representative images (left: brightfield, right: overlay) of high-throughput imaging cytometry of TK6 cells to analyze draq5-stained nuclei (yellow) with masks for binucleated cells (middle left large green overlays) and micronuclei (middle right small green overlays with white arrows). (d) Quantification of micronuclei in binucleated TK6 cells that were left untreated or exposed to plasma, UV light, or methyl methanesulfonate (MMS). Data are from two (b) and three to four (d) independent experiments with several replicates each. Data show violin plots (b) and min-to-max floating bars (d). Statistical analysis was done with one-way ANOVA.

