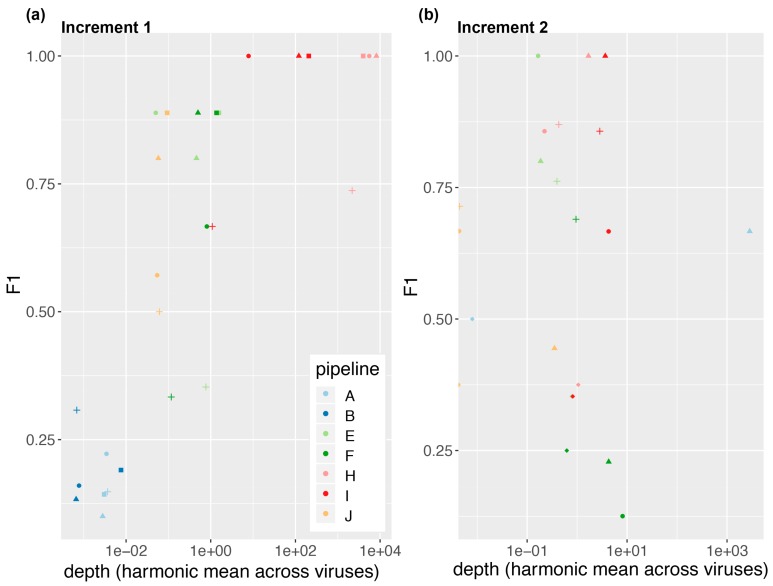
Figure 2.
Performance as a function of depth (Equation (1)) for (a) increment 1 and (b) increment 2. We show here the results when participants used the SIB-provided common database. Markers represent the samples: Plasma_spike_1-1 (square); plasma_spike_1-10 (triangle); plasma_spike_1-100 (circle); NIBSC_multiplex (cross and diamond (note: In increment 2, NIBSC_multiplex was present in duplicate, cf. Materials and Methods).

