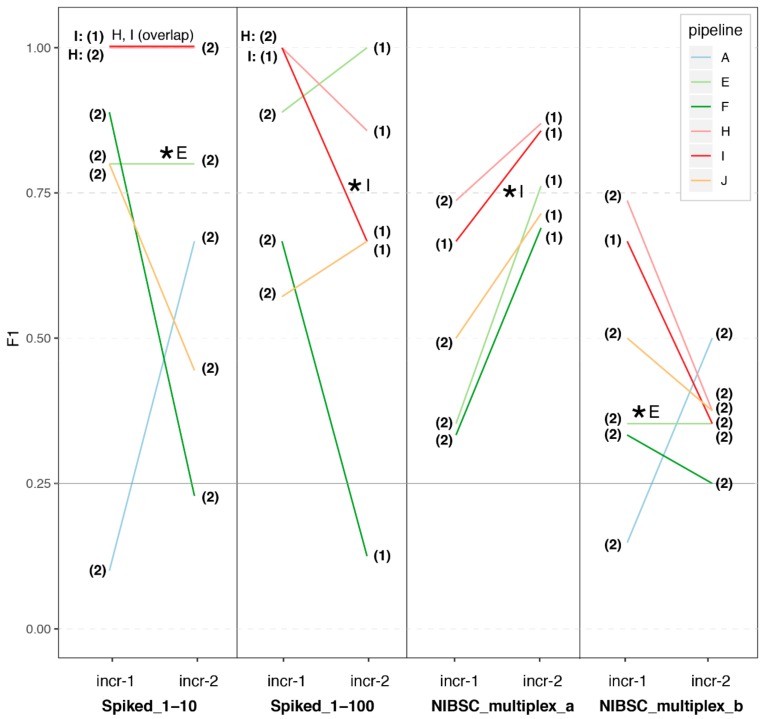
Figure 3.
Performance across pipelines on the spiked biological samples (increments 1 and 2). We plot the F1-score obtained by each pipeline on the four spiked biological samples provided in increment 1. We also plot the F1-score obtained by these pipelines in increment 2, on the same samples but starting this time from one common FASTQ dataset that we selected from the FASTQ datasets submitted by participants of increment 1 (indicated by a “*”, see also Table 1 and Materials and Methods). We also indicate with a number if the analyses were based on the single-end (1) or paired-end (2) reads. Note that pipeline A did not report any results for two of these samples in increment 2 (Spiked_1-100; NIBSC_multiplex_a), and their results in the corresponding panels are therefore not represented here.

