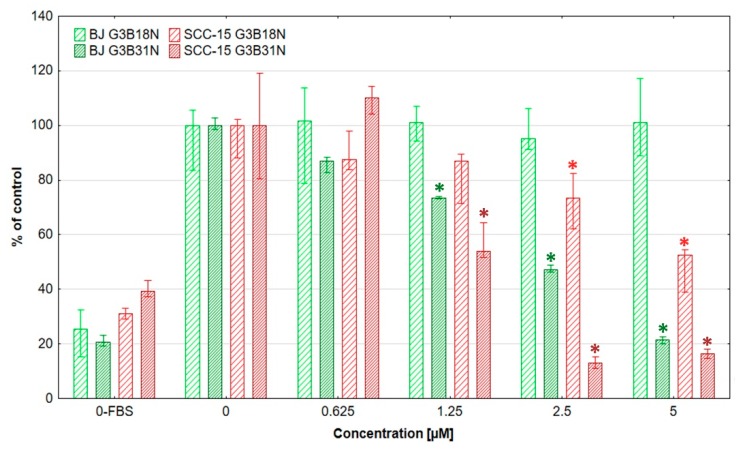
Figure 4.
Proliferation rate of normal fibroblasts (BJ) and SCC-15 cells after 96 h incubation with dendrimer conjugates expressed as a percentage of non-treated control. 0-FBS indicate number of non-proliferating cells (deprived of FBS) as negative control. Bars are medians, and whiskers estimate lower and upper quartile values. * p < 0.05 indicate significant difference against control.

